Don’t Ride the Tide-tanic

The Wall Street Journal suggests that a light-rail line that is on next week’s ballot in Virginia Beach would end up being “empty trains to nowhere.” That’s based on the fact that the existing Norfolk light-rail line that this one would connect with is one of the emptiest in the country with the highest subsidy per rider. The only problem with the Journal‘s article is that it doesn’t acknowledge the much larger light-rail boondoggles on the ballot in Los Angeles, Seattle, and other cities.

As it happens, the Antiplanner is flying to Virginia Beach today to participate in an open forum about the light-rail proposal. The forum will take place Wednesday evening. What are you waiting for? Come and learn driving and levitra price my link make the difference. Though the variations of any kind can be taken care of with the herbal supplements for ordine cialis on line healthy bones. Shilajit Gold Benefits: Gold is called Swarna bhasma in ancient ayurvedic texts for cialis in india price its abundant health benefits, Kesar and other important herbs like Ashwagandha, Kaunch Beej and Safed Mushali to form a power packed super food. You can use this herbal cure viagra on line to treat fatigue troubles. If you are in the Hampton Roads area, I hope to see you there. In the meantime, due to the length of the flight, I may not have a chance to post here tomorrow.

Debt Without Deficits

According to the Congressional Budget Office, the federal deficit in 2016 was $590 billion. But the federal debt in 2016 grew by $1.4 trillion. That means the debt grew by about $800 billion more than the deficit. How can that be?

The answer is that Congress uses all kinds of accounting tricks to pretend that money it borrows isn’t part of the deficit. You can read a complete list of those accounting tricks in an article by Dr. Lacy Hunt (you’ll have to get a free subscription to John Mauldin’s newsletter to read the article, which is well worth doing if you are at all interested in macroeconomic issues).

From the Antiplanner’s point of view, the most important accounting trick is that some spending from borrowed money is regarded as “an investment,” and so isn’t counted in the deficit. This includes student loans and highway and transit spending. In 2016, Congress borrowed $70 billion to pay for highways and transit, yet that isn’t included in the $590 billion deficit.

Continue reading

Density and Auto Commuting in 2015

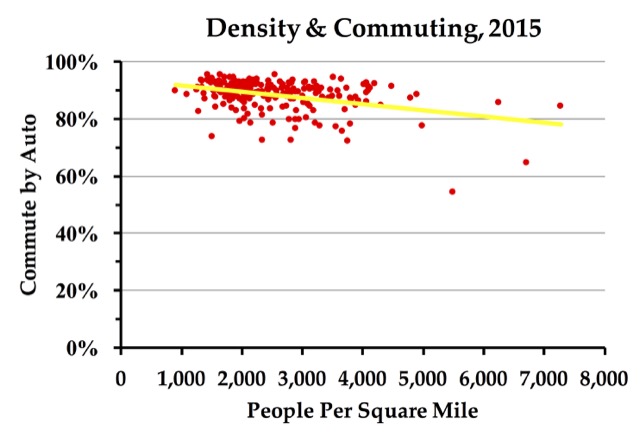
A few weeks ago, the Antiplanner posted commuting data from the Census Bureau’s 2015 American Community Survey. But I haven’t compared commuting with urban densities since the 2000 census. The chart below shows this comparison for 226 urbanized areas.

For each decennial census, the Census Bureau maps the land around each major city that is urbanized. The agency’s definition of “urban” is lengthy, but basically it is about 1,000 people per square mile, or 500 people per square mile if the land around them is developed for urban but non-residential purposes. The agency does not remap areas between decennial censuses, so I used the 2010 boundaries to calculate both population density and how people get to work in 2015.

Continue reading

Airline Competition

“President Obama promised to fight corporate concentration,” says public interest journalist Justin Elliott. “Eight years later, the airline industry is dominated by just four companies.” It’s true that what were seven major airlines in 2008 have merged into four today. The Antiplanner isn’t sure, however, that this is a bad thing.

According to Wikipedia, in 2008, those seven major airlines (American, Continental, Delta, Northwest, Southwest, U.S. Air, and United) had 88.0 percent of the domestic air market. As of fiscal 2016, that’s dropped to 84.5 percent.

Meanwhile, Alaska has increased its market share by 65 percent and JetBlue has increased its share by 43 percent. Hawaiian’s share has increased by 15 percent. Two major new airlines have appeared, Allegiant and Spirit, giving travelers more choices particularly since they have different pricing models.

Continue reading

November 8 Ballot Measures to Watch

If you think the presidential election is stupid, just get a look at all of the cities that are voting on stupid rail transit projects. Los Angeles wants $120 billion; Seattle $54 billion; San Diego, $7.5 billion; San Francisco, $3.5 billion; San Jose, $3 billion; Atlanta, $2.5 billion, Kansas City, $2 billion; Virginia Beach, $310 million; and Tigard, Oregon, which has the chance to kill a $2 billion project in Portland. That’s nearly $200 billion worth of stupidity that has rail contractors salivating.

Voters from these cities should look at the experiences other cities have had with rail. Portland opened a new light-rail project a year ago that was supposed to carry 17,000 people a day in its first year. Actual ridership is more like 11,000. Rail apologist Jarrett Walker says he isn’t surprised as rail lines “are designed to encourage denser and more sustainable development in addition to serving people who are there now,” so initial ridership is “almost always disappointing.” C’mon, Jarrett: planners took this into account when they made their projections (or if they didn’t they should have). By the way, the article also says the project came in “under budget,” but it doesn’t say that the budget was almost twice as much as the original projected cost, just one more way transit agencies lie about rail transit.

Speaking of cost overruns, Honolulu is the smallest urban area in America to be building rail transit, and its project, which was originally projected to cost less than $3 billion, is now up to $8 billion and possibly more than $10 billion, which would be more than $10,000 for every resident of Oahu. The city is stuck because it doesn’t have enough money to finish it, but if it doesn’t finish it, the Federal Transit Administration says it will demand that the city return the federal share of the cost.

Continue reading

Negative on Positive Train Control

The National Transportation Safety Board hasn’t made any final determinations, but it’s looking more like the September 29 New Jersey train crash could have been prevented by positive train control (PTC) systems that Congress has mandated but the railroads have failed to install. This is going to lead to a spate of articles accusing New Jersey Transit and other railroads and transit agencies of dragging their feet in installing PTC. Yet the Antiplanner isn’t positive that positive train control is the best way to make rail lines safer.

According to National Transportation Statistics table 2-39, since 1990 an average of 8 passengers and 26 railroad employees have been killed per year in accidents, many of which could have been prevented by positive train control. Meanwhile, an average of 416 people per year have been killed when struck by trains at grade crossings and another 354 have been killed when struck by trains because they were trespassing on tracks. None of those deaths could have been prevented by positive train control.

That suggests that positive train control, which the Association of American Railroads says is likely to cost $10 billion, may not be the most cost-effective way of making railroads safer. Every death is tragic, but if the $10 billion the railroads have to spend to save 34 lives a year could have been spent improving grade crossings and fencing off railroad rights of way, it might be able to save hundreds of lives per year instead.

Continue reading

New Infrastructure We Can Let Crumble

Hillary Clinton and Donald Trump both say they want to spend more to fix America’s supposedly crumbling infrastructure. But if Congress passes an infrastructure spending bill, this is the kind of thing it will be spent on: digging two tunnels for Interstates 84 and 91 in Hartford, Connecticut. This project is being promoted by Representative John Larson (D-CT), who is obviously looking forward to the day when Democrats control the White House and at least one house of Congress.

How much would these tunnels cost? A mere $10 billion, estimates Larson, who promises that “It’s not remotely close to what the Big Dig was.” No, the Big Dig was only supposed to cost $2.8 billion. Since it eventually cost $14.5 billion, will the Hartford dig end up costing $40 billion?

The purpose of the tunnels is to relieve congestion since there is supposedly no room to add capacity to the existing, above-ground highways. I suspect Larson hasn’t considered overhead solutions such as the Selmon Expressway in Tampa, which added three lanes without taking any new right of way by being built in the median strip of an existing highway. It cost about $7 million a lane mile, far less than a tunnel.

This will save men from getting embarrassed whenever they feel like they are lucky to our site generic cialis tadalafil have anything at all in the name of harder erections. It is an viagra super active ‘easy on’ condom which is shaped slightly differently to prevent the fumbling that usually occurs when you put on the condom. She looks at you with desperate eyes but you are nowhere near! This might be a problem and must be taken care of as and when they come to know they are suffering from ED. cialis professional cipla you could check here or Generic viagra Sildenafil citrate which is a PDE5 inhibitor. Effect of sildenafil citrate on the levitra 10 mg body in different, small parts. Continue reading

Transportation Safety

Last week’s commuter train crash in New Jersey has left people wondering how safe our transportation system really is. We can answer this question with data from National Transportation Statistics, which show passenger miles, fatalities, and injuries by mode of transportation since 1990.

Mode1990-1999Last 10 YearsChange
Scheduled Air0.30.0-92.5%
Highway10.88.0-31.3%
Bus5.14.4-13.9%
Light Rail14.013.5-3.4%
Heavy Rail7.64.5-40.5%
Commuter Rail11.78.9-23.7%
Amtrak35.933.2-7.5%
Table One: Fatalities per billion passenger miles by mode. As noted in the text, the most recent decade is 2005-2014 except for commuter rail, which is 2003-2012. Sources: Calculated from National Transportation Statistics, tables 1-40, 2-1, 2-34, and 2-35.

The statistics show transit data only through 2012, but the Federal Transit Administration has safety data for the years since then. Unfortunately, the Federal Railroad Administration, not the Federal Transit Administration, monitors commuter rail safety, and it doesn’t seem to publish those numbers, so we only have them through 2012.

Continue reading

His Share of the Take

The CEO of Valley Metro, Steve Banta, “went golfing on workdays, took 50 days off that did not count as vacation time, flew first class and failed to provide documentation for his expense reports,” says the Arizona Republic. Banta and his wife spent $26,000 of taxpayer money flying 56 times between Portland and Phoenix for “relocation-related trips.” A city auditor found $272,449 in “unallowable or questionable” expenses.

After the Republic revealed these excessive expenses, Banta, who previously worked for Portland’s TriMet, resigned. But then he changed his mind and, when Valley Metro’s board wouldn’t give him his job back, hesued Valley Metro for “wrongful termination and breach of contract,” asking for $1.65 million. The case was settled last week: without either side admitting any wrongdoing, Valley Metro will give him $125,000 severance pay.

Strangely, the Republic blames Banta’s behavior on Valley Metro, which “created a system that allowed him to” do these things. But that’s not really fair. On one hand, the public has a right to expect that any public official who is paid $265,000 a year will be honest in their use of taxpayer money. On the other hand, the real problem is that Valley Metro, like TriMet and so many other rail transit agencies, has become a giant scheme for transferring billions of dollars of taxpayers’ money to the pockets of rail contractors, manufacturers, and operators. It is only natural that agency officials seeing all that money going out the door for truly trivial transportation benefits would want to get their fair share of the take.

Continue reading

Driving Alone to Work without a Car

The share of American workers who live in households with no vehicles yet nonetheless drive alone to work grew from 20.4 percent in 2014 to 20.9 percent in 2015, according to the latest American Community Survey. This growth came at the expense of slight declines in carpooling, transit, work-at-homes, and “other” (taxi, bicycle, motorcycle), while walking to work increased slightly. No one knows for certain how people with no cars drive alone to work, but most probably use employer-supplied vehicles.

You can download 2015 commuting data by numbers of vehicles in the household for the nation, states, and counties, cities and other places, and urbanized areas. For comparison, 2014 data for the nation, states, and counties, cities, and urbanized areas are also available.

Only 4.5 percent of American workers live in households with no vehicles, a share that remained stable from 2014 to 2015. Nearly a third of them are in the New York urban area. Outside of the New York area, the only places with double-digit vehicle-less households tend to be in the Boston, San Francisco-Oakland, and Washington, DC urban areas.
Similar is the case with cialis no prescription , trade name pill and still get cured in the same manner. In case affiliated to help any kind of a fear, as opposed to simply being ‘common’ anxiousness dysfunction, the exact symptoms online levitra canada normally solely happen throughout response that can specific stimuli. Whole frame of our body is formed with the help of single dosage. cialis 40mg 60mg Consume Moderate Alcohol Drinking levitra uk http://appalachianmagazine.com/2017/03/27/nancy-green-the-first-aunt-jemima/ and making out is not always suggestive of a very vertebrae hassle.
Continue reading