The Vehicle Reliability Revolution

In 1970, the average car in the United States was 5.6 years old, and the average light truck was 7.3 years old. That meant that someone buying a car wouldn’t expect it to last much longer than 12 years, or 15 for light trucks.

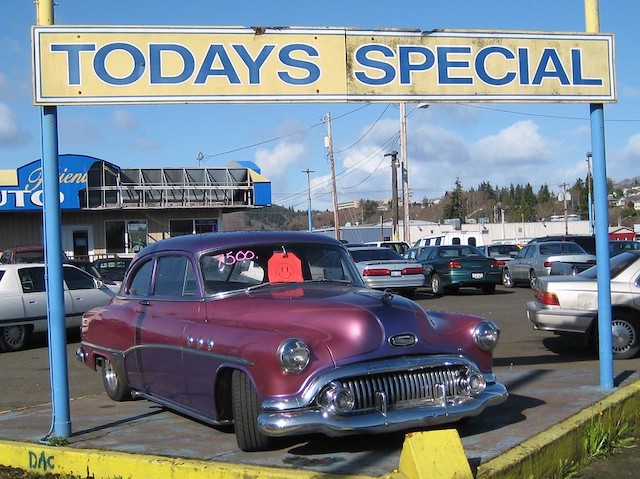
Used car for sale. Photo by John Lloyd.

On Monday, a research group called IHS Markit announced that the average age of cars and light trucks has increased to 12.1 years. Data from the Bureau of Transportation Statistics indicates that cars have caught up with light trucks in the longevity sweepstakes, so someone buying either a car or light truck today can expect it to last close to 25 years. Continue reading

The Gullibility Multiplier

A recent report published by the Transit Cooperative Research Program (TCRP) concluded that transit reduces greenhouse gas emissions. How can this be when (as the Antiplanner has shown) data published by the Departments of Transportation and Energy show that transit emits as much or more greenhouse gases per passenger mile as the average car?

Easy! The authors of the TCRP paper, using the same data I used, found that transit emitted as much or more greenhouse gases per passenger mile as the average car. They also admitted that without transit, only “33 percent of transit passenger miles would otherwise be replaced by personal vehicle miles,” which means transit is three times worse than driving.

However, they then introduce two magic numbers that, when combined with transit’s real emissions, allow them to make it appear that transit is saving huge amounts of total emissions. The first magic number is called the land use efficiency multiplier. It assumes spending money on transit would lead to land-use changes that would in turn lead people to drive less, including people who don’t ride transit. The second magic number is called the transit efficiency multiplier, and it assumes that people who ride transit, say, 100 miles a week avoid several hundred miles of weekly driving. Continue reading

Does Transit Cost-Effectively Help the Poor?

Almost every effort to justify subsidies to urban transit makes similar claims: transit supposedly saves energy, reduces greenhouse gas emissions, promotes economic development, relieves congestion, and helps low-income people. Previous policy briefs have shown that, in all but a handful of urban areas, transit uses more energy and produces more greenhouse gases than the average car; often makes congestion worse; fails to promote economic growth; and hurts the 95 percent of low-income workers who don’t ride transit.

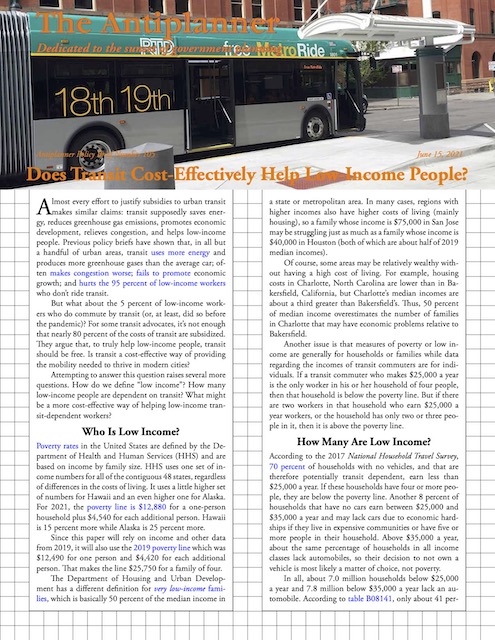
Click image to download a three-page PDF of this policy brief.

But what about the 5 percent of low-income workers who do commute by transit (or, at least, did so before the pandemic)? For some transit advocates, it’s not enough that nearly 80 percent of the costs of transit are subsidized. They argue that, to truly help low-income people, transit should be free. Is transit a cost-effective way of providing mobility needed to thrive in modern cities? Continue reading

Five Reasons for Infrastructure User Fees

An op-ed in the Orange County Register offers five reasons why transportation infrastructure should be paid for out of user fees, not taxes. A similar case can be made for other kinds of infrastructure as well.

Unfortunately, it has become easier to ask the federal government to pay for everything out of funny money (deficit spending) than to charge people user fees. Case in point: Oregon water infrastructure, which a recent study found has billions of dollars of maintenance backlog.

Years ago, some fiscal conservatives put a measure on Oregon’s statewide ballot to require local governments to get voter approval for any increases in taxes or user fees. I told them that they should limit this to tax increases only, but they said they didn’t trust the government to not hide tax increases in user fee increases. Most water departments in Oregon are government owned, and since that ballot measure many cities have been unable to finance major rehabilitation programs because voters haven’t approved them. Continue reading

Traffic Fatality Rate Highest Since 2004

An estimated 38,680 people died in motor vehicle traffic accidents in 2020, a 7 percent increase from 2019, according to the National Highway Traffic Safety Administration (NHTSA). This is despite the fact that Americans drove 13 percent fewer miles in 2020 than they did in 2019. One caveat: the 2020 numbers are only preliminary based on a “statistical projection.”

The reported increase in fatalities pushed fatality rates up to 13.7 deaths per billion vehicle-miles traveled in 2020 and 1.45 in the last nine months of 2020, the highest rate since 2004. Fatality rates had declined to just 10.8 per billion miles in 2014, then hovered between 11 and 12 for the next five years.

The 2008 financial crisis led to a 1 to 2 percent annual decline in driving in 2008 and 2009, which resulted in a nearly 10 percent annual decline in fatalities. The pandemic led to a 13 percent decline in driving, yet fatalities increased. What was the difference between these two events that one made highways safer and the other made them more dangerous? Continue reading

House Dems Propose $547 Transport Bill

Democrats on the House Transportation and Infrastructure Committee are proposing to increase transportation spending from $305 billion over the last five years to $547 billion over the next five years. Although this is supposed to be a five-year bill, it will really be a six-year bill spending at least $656 billion, as Congress is never able to pass a major bill during an election year and will simply extend it a sixth year at the then-current rate of spending.

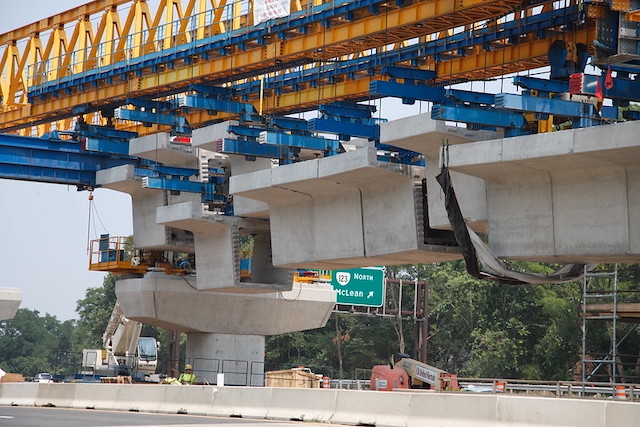
Many megaprojects, such as Boston’s Big Dig and Dulles MetroRail (shown here) are built not because they are needed but because politicians can get the federal government to pay for them with “free” money. The proposed transportation bill will encourage more such megaprojects. Photo by Tom Saunders, Virginia Department of Transportation.

The proposed bill would increase spending on highways by 54 percent, double spending on transit, and triple spending on Amtrak. Although transit and Amtrak together carried 1.0 percent of passenger miles before the pandemic and less than 0.6 percent of passenger miles in the last year, the bill would give them 37 percent of the federal funds. Moreover, while federal funding of roads would be hampered by a “fix-it-first” rule, federal spending on transit would have no such limit even though transit infrastructure is in much worse shape than highway infrastructure. Continue reading

Transit & Amtrak Lag Behind Driving & Flying

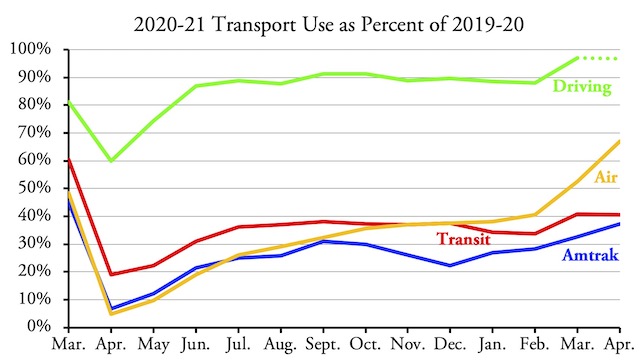
Transit carried 40.5 percent as many riders in April, 2021 as in April, 2019, according to data released by the Federal Transit Administration last Friday. This is a slight step backwards from March, in which transit carried 40.8 percent as many people as in March 2019.

As indicated by the dotted line, driving data are not yet available, but a future Antiplanner post will update this chart when they are published.

Amtrak was even worse, carrying 37.2 percent of its 2019 passenger-miles, according to the company’s monthly performance report. This, however, was a bigger improvement over March, when it carried 32.7 percent of 2019 passenger-miles. Continue reading

A Lot of Blame to Go Around

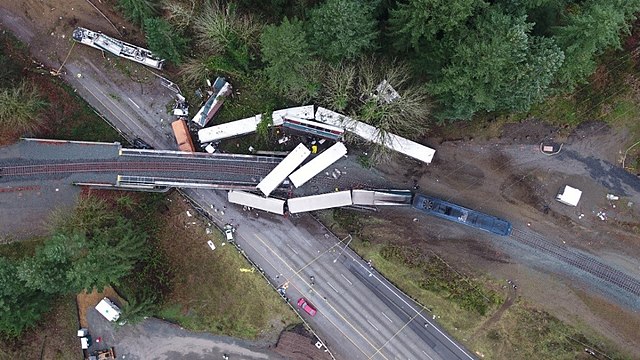
Three-and-one-half years ago, the first Amtrak train over a new, shorter route between Seattle and Portland crashed and killed three passengers. Now Steven Brown, the engineer who went 80 miles per hour around a 30-mph curve, wants to be reinstated, saying the accident was Amtrak’s fault, not his.

It was Amtrak’s fault because, he admits, he was inexperienced with the route (having made “only” three practice runs and seven to ten observational runs) and had never run that model of locomotive before. Given this lack of experience, he says, Amtrak never should have assigned him the train. Of course, as it was a brand-new route, all of Amtrak’s engineers were equally inexperienced with the terrain, and he was given the job because he had scored 100 percent on a written exam for the route. Continue reading

No Light Rail for You, San Jose

After last week’s shooting, restoring light-rail service to Silicon Valley will take “weeks or months, not days,” says a representative of the Santa Clara Valley Transportation Authority (VTA). In place of light rail, the agency was providing “bus bridges” to serve light-rail routes.

On Monday, however, VTA announced that it would discontinue such bus bridges. Instead, it “is directing all resources to the regular bus network that serves the majority of our riders who rely on public transit the most.” In other words, light rail serves mainly high-income workers who aren’t riding anyway because they are working at home. So those who were still riding light rail before last Wednesday must hustle to find alternate transportation such as riding buses that don’t necessarily parallel the light-rail lines.

If these light-rail lines were so important to the region that they had to be built, it seems like they would be important enough to keep running buses serving their customers while the rail system is out of commission. VTA is tacitly admitting that it was a mistake to build them in the first place. Continue reading

San Jose Discovers Light Rail Is Not Resilient

As of this writing, light-rail service in San Jose remains cancelled more than 24 hours after the mass shooting that left 10 people dead. This was a terrible event, and I join Governor Gavin Newsom in wondering “what the hell is going on in the United States?” Beyond that, I don’t feel qualified to write about gun control, mental illness, or other factors that may have played a role in this tragedy.

However, it does point out one more problem with light rail or any rail transit: such systems require central control that can easily be disrupted by accidents, terrorists, or other criminals. Buses, which the Valley Transportation Authority is using in place of light rail in the aftermath of the shooting, don’t need such central control and are less vulnerable to natural or human-caused disasters.

Light rail has been a thorn in the side of Silicon Valley transportation since the 1980s. San Jose’s bus-only system carried 38.5 million trips in 1984, or 29 trips per resident of the San Jose urbanized area, also known as Silicon Valley. Continue reading