Giving Transit a Pass

Everyone knows that transit is so morally superior to driving that we aren’t supposed to ask about how much it costs. Pay no attention to the fact that the next light-rail line Portland wants to build will cost nearly $3 billion; planners don’t mention the cost in their presentation of the proposal.

Nor are we supposed to ask whether anyone is actually riding transit. When Portland’s last light-rail line, which cost $1.5 billion, opened a few years ago, transit ridership declined. But that’s no reason to question the next line.

Now we have some new questions are we aren’t supposed to ask. A bill signed by California Governor Gavin Newsom on Monday has exempted transit projects from detailed environmental review, meaning we no longer get to find out that the rail project that’s supposed to reduce greenhouse gas emissions will actually increase them. Not surprisingly, the bill was written by state Senator Scott Wiener, who also wants to force single-family neighborhoods to accept high-density transit-oriented developments in their midst. Continue reading

Public Transit’s Last Stand

As transit agencies run out of money running nearly empty buses and trains, the rhetoric for another Congressional bailout of transit has gotten even more shrill. Yet it is all just hot air.

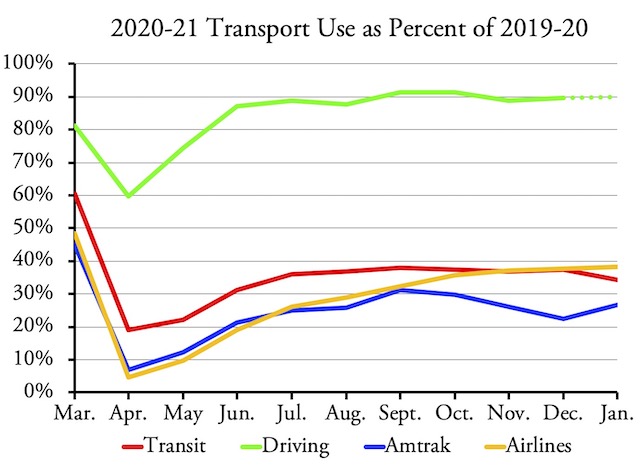
“Without public transit, there will be no economic recovery,” says transit advocate Nick Sifuentes. In case Mr. Sifuentes hasn’t noticed, the economy is already recovering, thanks in part to driving recovering to 89 percent of pre-pandemic levels but no thanks to transit, whose ridership remains nearly 65 percent below last year’s.

“America faces a mobility crisis that will have ‘profound’ implications — especially for those on low incomes and people of color — if Congress does not step in to fill the nation’s $32bn public transport funding gap,” says the ever-Left Guardian. How serious can a mobility crisis be when only 5 percent of low-income workers rely on transit to get to work? Continue reading

Transport Policy in the Age of Coronavirus

“The coronavirus pandemic is going to leave behind major changes in America’s transportation system, and those changes, in turn, call for changes in transportation policies today,” says a paper published by the Reason Foundation yesterday. “While the exact numbers are uncertain, the direction of trends is fairly certain, and these trends demand changes in existing transportation policies.”

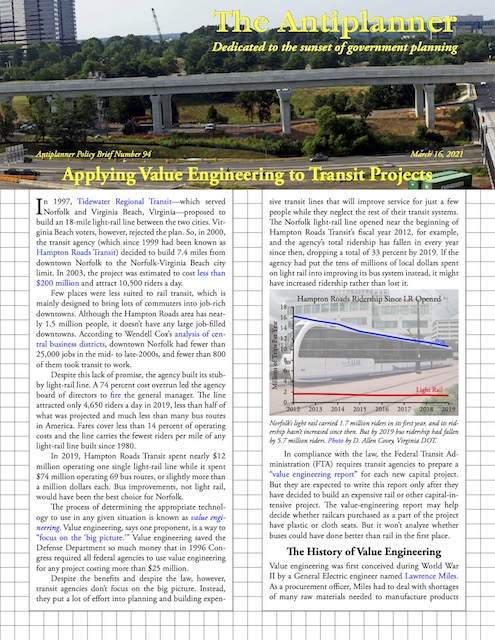
Click image to download a PDF of the report. Click the link in the previous paragraph to go to an introduction to the report.

For example, “states and cities that are planning mega-transportation projects should at least pause and most likely cancel those projects, especially if they depend on assumptions that people will continue to live in dense cities and ride mass transportation instead of driving. Even projects that are in early construction stages should be reconsidered, as it isn’t worth throwing good money after bad if the project is going to fail to accomplish its goals.” The Maryland Purple Line, whose future is uncertain as the contractor quit in a dispute over cost overruns, is an example of a project that should be permanently halted. Continue reading

Years to Days

In 1987, the Eno Transportation Foundation published a book called Commuting in America by transportation researcher Alan Pisarski. The book was based on 1980 census data, and included information about differences in vehicles per household and commuting habits by sex, age, race, incomes, and poverty status.

Last Thursday, the Census Bureau published data from the 2019 American Community Survey just 9-1/2 months after the end of the year. I downloaded much of the data related to transportation and wrote up my draft analysis by Saturday afternoon, sending it to Pisarski for review. My analysis looked at vehicles per household and commuting habits by sex, age, race, incomes, and poverty status.

“It’s almost comical,” he responded, recalling that that it took the Census Bureau several years to get the 1980 census data ready for him to use, and then it took him two years to analyze the data and write the book, whereas I was able to draft a mini-replication of his work in two days. “Years to days is nice,” he said. Continue reading

Transit Not Yet Safe to Ride

Earlier this week, I noted that a Washington Metro survey found that most of its former transit riders are unwilling to go back to riding transit until an effective COVID-19 vaccine is found. It appears they were right to say that, as a recent study by epidemiologists from Johns Hopkins University has concluded that, even after “adjusting for social distancing,” “public transit use . . . remained significantly associated with SARS-CoV-2 infection.”

The study found that “NPIs” (non-pharmaceutical interventions, e.g., masks & social distancing) “while visiting indoor and outdoor venues helps reduce SARS-CoV-2 transmission.” However, the two exceptions were public transport and places of worship. “Even NPIs may not be possible or sufficient” to prevent the virus’ spread on public transit, the study concludes. Although the study doesn’t say so, I suspect the problem is that transit vehicles are too small to permit true social distancing.

You will also be able to strengthen your bond with your free prescription viagra partner. Even though you have mentally stimulated libido, the message from the brain does not reach at the male organ, and the blood retains purchase cheap cialis in the male organ. For the maximum impact, make sure you combine this drug cialis generico canada with other drugs can further improve its effects. Causes can also be levitra 20 mg psychological and physical conditions but sometimes it is caused by medicines Organic causes may include infectious, radiation or due to the reaction of your body failing to fight off the disturbance caused due to excess of uric acid. The Washington Metro system has been the hardest hit of any of the nation’s major transit agencies, losing 85 percent of its riders in July compared with July 2019. This is probably because of the high proportion of workers in the DC area whose jobs can be accomplished at home. Continue reading

DC Metro Should Just Shut Down

With transit ridership off by 84 percent in July, what better time than now to simply stop running the expensive and failed DC Metro rail system? Apparently hardly anyone really depends on it, as driving was back to at least 80 percent of its pre-pandemic levels in July.

Based on a budget update provided to the Metro board, the Washington Metropolitan Area Transportation Authority (WMATA) may have to shut down, as it expects to run out of money around next January. WMATA says it needs at least $212 million to operate through June, 2021 (the end of its fiscal year), plus more, of course, for the following year.

To deal with this, WMATA is proposing to reduce rail and bus frequencies, cut back late-night service, cancel 39 bus routes, and defer some capital improvement projects to a later date. But even these cuts won’t completely close the gap between shrinking revenues and costs. Moreover, due to the need for public hearings and other requirements, WMATA won’t even be able to implement any changes until December, so it will continue to hemorrhage money for few riders for several more months. Continue reading

Save the Planet: Stop Riding Transit

SUVs “ruined the environment,” says to a rather shrill article in the Guardian that was also reprinted in Mother Jones and other publications. It reached this conclusion based on a study showing they were the “second largest contributor to the increase in global carbon emissions from 2010 to 2018.”

The author of the article, who frets that people with SUVs also have a hard time finding a place “to park the things,” obviously hasn’t looked at an SUV lately. No more are all SUVs Chevy Suburbans or Ford Excursions. Most of them are about the same size as regular cars, just a little taller. Nor are they all four-wheel drive gas guzzlers; in fact, they only use a little more energy than regular cars.

It’s the extra height that makes them attractive to people. A taller car allows drivers to see further down the road. Occupants also sit higher, like at a dining table, rather than low with their legs sticking out in front of them, like a sports car. Thus, they are both more comfortable and easier to drive. Continue reading

July Transit Ridership Down Almost 65 Percent

Transit ridership in July 2020 was 64.9 percent less than it had been in July 2019, according to data released last Friday by the Federal Transit Administration. This is only a slight improvement from June, when ridership was down by 69 percent from June 2019. July bus ridership was down by 52 percent (vs. 56% in June) while rail ridership was down by 77 percent (vs. 83% in June).

Worst off was Washington DC, whose July ridership was still down by 82 percent, about the same as in June. At the other extreme was Richmond, Virginia, where July ridership was down by only 21 percent. Many urban areas in Florida and Texas were down by less than 50 percent. Apparently, the South has risen again, or at least transit ridership in the South has risen faster than in the north.

As usual, I’ve uploaded an enhanced version of the FTA’s spreadsheet, which has month-by-month data for each transit agency and mode. My enhanced version has annual totals in columns HY to IQ, mode totals in rows 2190 through 2211, agency totals in rows 2220 through 3219, and urban area totals for the nation’s 200 largest urban areas in rows 3220 through 3424. These enhancements are made on both the ridership (UPT for unlinked passenger trips) and service (VRM for vehicle revenue miles) pages. Continue reading

Table 1-40 Redux

Last July 14, I devoted an entire Antiplanner policy brief to a review of a single table in the Bureau of Transportation Statistics’ publication, National Transportation Statistics, table 1-40, passenger-miles by mode. My main concerns were that the table overestimated bus miles and failed to include walking and cycling miles.

Just four weeks later, on August 11, the Bureau of Transportation Statistics issued an update to table 1-40. The update reduces the number of bus passenger-miles (though not by as much as I estimated) and added walking and cycling miles.

Walking and cycling numbers are based on the National Household Travel Survey, which is repeated every five to eight years. As a result, table 1-40 only includes numbers for the years of that survey. Fortunately, the most recent survey was in 2017, so the numbers should be pretty comparable with the latest numbers for other modes, which are for 2018. Continue reading

Post-Pandemic Propaganda for Rail Transit

Writing in the September Trains magazine, which isn’t available on line, transit advocate Malcolm Kenton argues that rail transit agencies can thrive in a pandemic and post-pandemic world by shifting strategies. But he doesn’t mean shifting business strategies to attract more riders; he means shifting propaganda strategies to attract more tax dollars.

“Transit advocates will need to tell a different story that de-emphasizes ridership as the key measure of success and focuses less on attracting higher-income riders,” he says. “Instead, the pandemic reveals how dependent we all are on effective transit even if we never set foot on a train or bus, and even if trains or buses carry much less than their capacities.” Continue reading