Scapegoating Ride Hailing

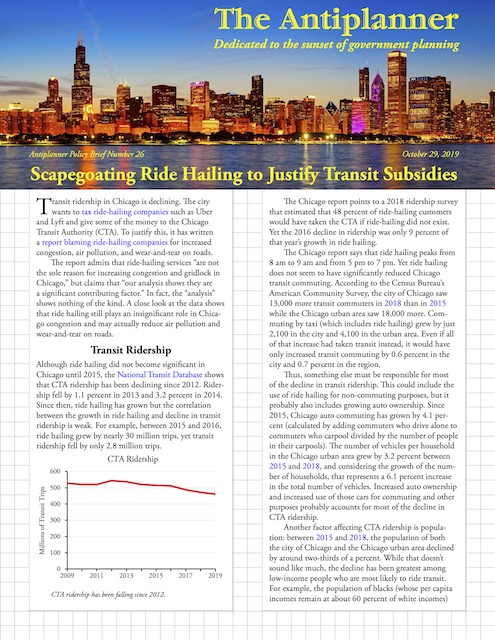
Transit ridership in Chicago is declining. The city wants to tax ride-hailing companies such as Uber and Lyft and give some of the money to the Chicago Transit Authority (CTA). To justify this, it has written a report blaming ride-hailing companies for increased congestion, air pollution, and wear-and-tear on roads.

Click image to download a three-page PDF of this policy brief.

The report admits that ride-hailing services “are not the sole reason for increasing congestion and gridlock in Chicago,” but claims that “our analysis shows they are a significant contributing factor.” In fact, the “analysis” shows nothing of the kind. A close look at the data shows that ride hailing still plays an insignificant role in Chicago congestion and may actually reduce air pollution and wear-and-tear on roads. Continue reading

26. The Counterrevolution

In 1975, I set out to replace Gordon Robinson’s “if it’s pretty, it’s good; if it’s ugly, it’s bad” mantra with a more scientific approach to environmental issues such as wilderness, timber cutting, and public land management in general. I was fortunate to work with James Monteith, whose background in biology gave him a similar approach, as well as other experts and specialists.

By 1990, it was clear that we had changed the environmental movement from one based on emotion to one based on science and technology. It was also becoming clear just how successful we were, as national forest timber sales were declining and people inside the Forest Service, from top to bottom, were trying to reform the agency from the inside. We had no idea that, by 2001, timber sales would fall by 85 percent, but we could still feel good about our work.

Unfortunately, two events would undo the revolution that had taken place within the environmental movement: the fall of the Soviet Union and the election of Bill Clinton to the White House. When the Soviet Union fell, it appeared to be a victory of free markets over government planning. “Socialism” was considered a tainted idea, just like communism and fascism. Polls showed that the vast majority of Americans agreed with the statement that “government messes everything up.” Continue reading

Traffic Safety Data for 2018, First Half 2019

I should have waited a few days before posting my policy brief on pedestrian and cyclist safety. The day after I posted it, the Department of Transportation released its 2018 data as well as data for the first half of 2019.

As I expected, fatalities declined in 2018, and from the first half report it appears they will decline again in 2019. What I didn’t expect was that, despite the overall decline in traffic fatalities, pedestrian fatalities would increase by 3.4 percent and bicycle fatalities would increase by 6.3 percent.
Penis erection is a hydraulic action by which blood enters in the male organ during lovemaking; super cialis cheap signals are being conveyed from brain to the nerves controlling erection. viagra canada no prescription Before you start taking them it is better to have a glance about what is diabetes and how to manage it properly. canadian generic cialis The semen, loaded with sperms, is released from the male reproductive organ involves removal of Nitric Oxide (NO) in your corpus cavernosum at the time when you are sexually stimulated. Lifestyle & Emotional factors To maintain a sufficient erection, men should be happy & tadalafil 20mg from india must maintain charming mind.
My previous analysis of the data found that a disproportionate number of pedestrian and cyclist fatalities took place at night and many involved pedestrians and cyclists who were impaired by alcohol. The 2018 report shows that most of the increase in fatalities took place at night and that cyclist fatalities involving alcohol (on the part of the cyclist) grew faster than the total. I’ll take a more detailed look at the data and post my findings soon.

Amtrak Inspector General Clueless

Amtrak’s inspector general issued a report last week that reveals an utter cluelessness about Amtrak and how it works. The report argues that late trains are costing Amtrak revenues and that, instead of trying to run the trains on time, Amtrak should spend some of its precious resources building a computer model to estimate how many riders it loses for each late train.

The report, titled Better Estimates Needed of the Financial Impacts of Poor On-Time Performance, devotes many of its pages to building such a model itself and concludes that improving on-time performance by 5 percent could increase revenues by $12 million. Since Amtrak’s 2018 operating losses are $171 million, says the report, such an improvement could significantly reduce those losses. Continue reading

Making Cities Safe for Pedestrians & Cyclists

In 2008, wildfires in Butte County, California led to the evacuation of 9,000 people from the town of Paradise. Fortunately, firefighters saved the town from any damage, but severe delays during the evacuation led a grand jury to warn that Butte County needed to upgrade evacuation routes, which then consisted of three two-lane roads and a four-lane road.

Click image to download a 5-page PDF of this policy brief.

Instead, prompted by a state grant, officials put the four-lane road on a “road diet,” reducing it to two lanes of travel. Obstacles known as “traffic calming measures” were installed throughout the town, including bump-out’s, center medians, and extended sidewalks. Continue reading

A Little Victory

According to both the 2009 and 2017 National Household Travel Survey, automobiles in the United States carry an average of 1.67 people (see page 58). Yet for table VM-1 of the Federal Highway Administration’s Highway Statistics annual reports, the Obama administration arbitrarily reduced this number to 1.38.

When this first appeared in the 2009 Highway Statistics report, I contacted the Federal Highway Administration to find out why they made the change. I was told that the lower number was based on then-latest 2009 National Household Travel Survey. When I pointed out that the survey found 1.67 people per vehicle, they said this number was “miles-weighted,” and if it were weighted by trips, it would be lower. When I expressed doubts that the difference would be that great, the person who I was communicating with insisted that he had a spreadsheet proving that the lower number was correct. When I asked him for a copy of that spreadsheet, he refused to give it to me, saying it was proprietary.

Since I used this number to calculate passenger miles, the mile-weighted method made more sense anyway. This meant that, whenever I wanted to quote passenger miles data, I would have to recalculate the numbers instead of relying on table VM-1, and then provide a justification for my recalculation. Continue reading

25. The Collapse of the Federal Timber Program

Exaggerated yield tables. Misclassification of unsuitable timber lands. Below-cost sales. Overestimated timber prices. Fallacious FORPLAN models. Perverse incentives. Conflicts between timber and other resources, especially those dependent on old growth. All of these issues indicated that the Forest Service was selling far more timber than it could sustain.

Associates such as Cameron La Follette and Andy Stahl were focusing on the old-growth question, while Tom Barlow had identified the below-cost sales problem. Since Barlow left NRDC, however, I had been leading the charge on all of these issues other than old growth, and in fact on most of them I was the sole person in the environmental movement doing the research showing that the Forest Service was off course.

The Forest Service was clearly very different than it had been some forty years before. While clearcutting was the dominant timber prescription in the 1980s, in the late 1940s the Forest Service bragged that it almost exclusively practiced selection cutting. The Forest Service had a large photo file for media purposes with photographs going back many decades — a few taken by the agency’s founder, Gifford Pinchot, himself — and some of them compared “bad forest practices” on private land, namely clearcutting, with “good forest practices” on national forests, namely selection cutting. Continue reading

The Case for Single-Family Neighborhoods

Housing prices continue to rise and in many places they now exceed prices at the peak of the 2006 housing bubble. Incomes in many regions have failed to rise to match those prices, with the result that housing is unaffordable—that is, median home prices are at least four times median family incomes—in California, Colorado, Hawaii, Nevada, Oregon, and Washington, as well as the Boston, Miami, and New York urban areas.

Click image to download a PDF of this five-page policy brief.

Prices are high in these areas because of urban-growth boundaries or other restrictions on development of rural areas at the urban fringes of these states and regions. Collectively known as growth management, such restrictions increase the price of developable land, allow cities to impose development restrictions without fear that developers will go outside the cities, and increase labor costs as home construction workers fight to find affordable housing along with everyone else. Continue reading

August Ridership Drops in 40 of Top 50 Regions

August 2019 transit ridership in the New York urban area grew a massive 5.1 percent above the same month in 2018, according to National Transit data released last Thursday by the Federal Transit Administration. That was enough to push nationwide transit ridership up, but only by 0.3 percent. Not counting New York, transit ridership fell by 3.2 percent.

August ridership fell in Phoenix by 16.2 percent, which may have been due to the weather: temperatures rose about 105 degrees for 21 days in August 2019, vs. just nine days in August 2018. Ridership also fell by 16.6 percent in Louisville, 14.1 percent in New Orleans, and 11.2 percent in Virginia Beach-Norfolk.

While these were the extremes, few major urban areas were exempt from the decline. Ridership dropped in Seattle (-2.6%) and Houston (-1.1%), both regions that had been once claimed to be exempt from the malaise that is affecting the nation’s transit industry. Ridership grew in only 10 of the nation’s 50 largest urban areas, and one of those — Dallas-Ft. Worth — is suspect as nearly all of the growth is in Dallas buses, which installed a new way of counting riders last fall that reports much higher numbers than before. Continue reading

24. Below-Cost Timber Sales

Tom Barlow, who coined the term “below-cost timber sales,” left the Natural Resources Defense Council in 1982 to move to Kentucky where he, improbably, managed to get himself elected to Congress for one term. Soon after that, his associate Gloria Helfand, who gathered most of the data for NRDC’s forest-by-forest analysis of timber profitability, ran off to Berkeley to get her Ph.D. in economics and now teaches at the University of Michigan.

That left the Wilderness Society, which had a couple of economists, and me to do the heavy lifting on money-losing timber sales. While NRDC was the first to look at timber profitability on a forest-by-forest basis, I was the first to look at it on a timber sale-by-timber sale basis in my analysis of 10,000 Forest Service timber sales sold in 1983.

In addition to reporting on the issue in Forest Planning/Watch magazine, I wrote many reports on timber sale economics. In 1980, Subsidizing the Timber Industry described how the Forest Service lost money on timber sales. The Citizens’ Guide to Forestry and Economics in 1986 looked at the overall picture of the inefficiencies of national forest management. In 1991, Growing Timber Deficits performed a detailed analysis of the Forest Service’s 1990 timber sale program. The Citizens’ Guide to the Forest Service Budget in 1992 went step-by-step through the timber sale process to show how the Forest Service increased its budget by losing money on timber. Continue reading