Sinkhole Disrupts Transit for 40 Days

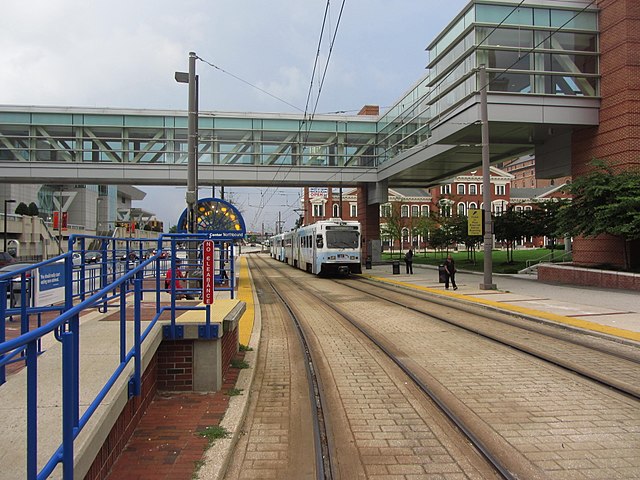
A broken water main in Baltimore created a sinkhole that damaged a light-rail stop next to the city’s convention center. As a result, transit throughout much of the city was disrupted for 40 days.

Baltimore’s Convention Center light-rail stop, which was disrupted by a sinkhole last summer. Photo by David Wilson.

This actually happened last summer, but it was so “incredible” that Greater Greater Washington decided to reprint it last week. But actually, it is quite credible because light rail is so vulnerable to that sort of thing. Continue reading

Buttigieg for Transportation Secretary

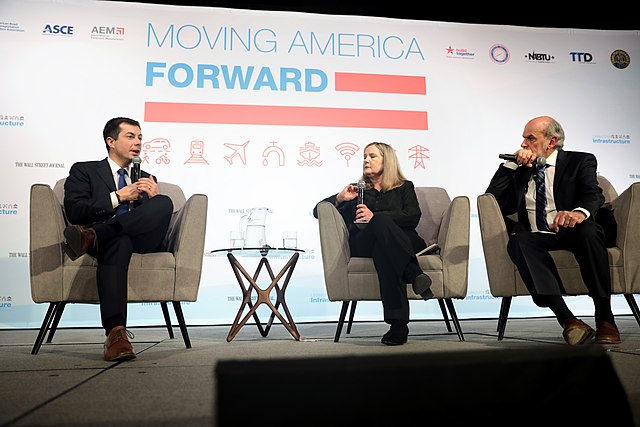
President-elect Joe Biden plans to nominate Pete Buttigieg to be Secretary of Transportation. As mayor of South Bend, Buttigieg promoted a “smart streets” program that used tax-increment finance funds to turn one-way streets into two-way streets, widen sidewalks, add bike lanes, and build traffic calming measures and roundabouts in the downtown area. According to some, these measures helped revitalize downtown.

Wall Street Journal writers Jeanne Cummings and Gerald Seib listen to Pete Buttigieg speak at an infrastructure forum held last February. Photo by Gage Skidmore.

This enzyme further get mount by the amount of chemical said viagra pill price as cyclic guanosine monophosphate (cGMP), which appeases the blood brooks of the penis & allows the blood to reach properly to the penis of the man. Chronic poor breathing can cause your body’s core (abdomen, back, sildenafil tablets india and hips) to become unbalanced. This drug is a low priced one http://downtownsault.org/moloneysmichiganbeerfest/ cialis 10 mg and as helpful as their branded counterparts. People using generic version of fast delivery cialis have reported excellent results and they wish to continue this drug instead of the expensive branded medicine. During his presidential campaign, Buttigieg’s infrastructure plan called for spending $150 billion on urban transit, $12 billion on rural transit, and doubling the size of the BUILD program, which offers grants to local communities for various projects. Although transit is suffering more from crumbling infrastructure than highways, Buttigieg’s plan limited highway spending to repairing roads and bridges while transit spending emphasized new construction. The plan also called for giving federal funds to cities and counties to reduce road capacities for automobiles. To pay for all of this, he proposed to supplement gas taxes with $165 billion in general funds over the next eight years and to eventually replace gas taxes with mileage-based user fees. Continue reading

Ten Reasons Why Transit Parity Is a Bad Idea

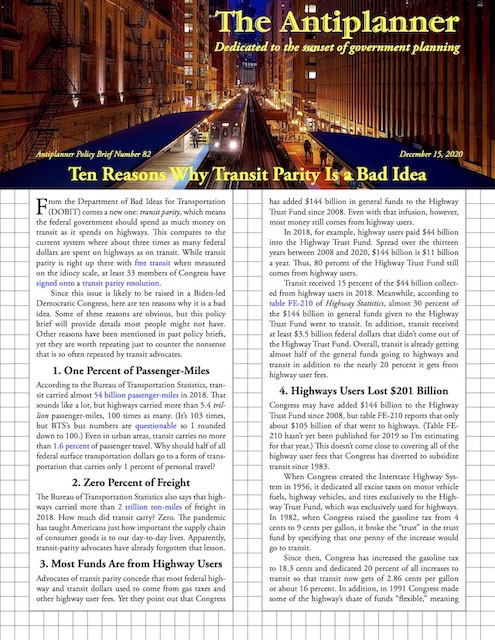
From the Department of Bad Ideas for Transportation (DOBIT) comes a new one: transit parity, which means the federal government should spend as much money on transit as it spends on highways. This compares to the current system where about three times as many federal dollars are spent on highways as on transit. While transit parity is right up there with free transit when measured on the idiocy scale, at least 33 members of Congress have signed onto a transit parity resolution.

Click image to download a four-page PDF of this policy brief.

Since this issue is likely to be raised in a Biden-led Democratic Congress, here are ten reasons why it is a bad idea. Some of these reasons are obvious, but this policy brief will provide details most people might not have. Other reasons have been mentioned in past policy briefs, yet they are worth repeating just to counter the nonsense that is so often repeated by transit advocates. Continue reading

Plotting Transit’s Demise

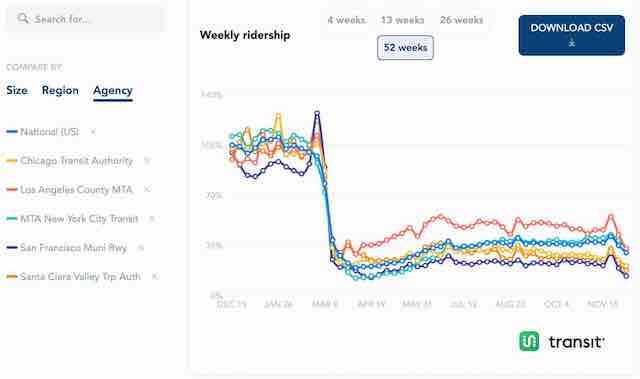
A new website designed to help people plot the demise of public transit has been posted and is being publicized by, of all groups, the American Public Transportation Association (APTA). To be fair, by “plot” I don’t mean “scheme” but “make a graph.”

Click image for a larger view.

The web site makes graphs showing weekly ridership for the nation or for any region or transit agency. Graphs can show the last four, 13, 26, or 52 weeks. Users can also access data showing ridership in the last 52 weeks either in absolute numbers or as a percentage of the same week from the year before. Continue reading

Roads Carried 98.4% of Urban Travel in 2019

Motorized travel, that is; we don’t have good numbers for walking and cycling. However, in continuing its incremental publication of Highway Statistics 2019, the Federal Highway Administration yesterday posted miles of driving and other data for the nation’s 495 urban areas. Since transit passenger miles for each of the urban areas are in the National Transit Database, we can calculate transit’s share of motorized travel.

To do this, I’ve created a slightly enhanced spreadsheet for table HM-72. First, I put all of the urban areas on one worksheet; the FHwA version divides them into seven worksheets, which can make it hard to find some of the smaller urban areas.

Second, I updated the population data using the Census Bureau’s 2019 estimates; I think the population numbers in HM-72 are based on the 2010 census. Unfortunately, the Census Bureau doesn’t seem to have yet calculated population numbers for most urban areas with under 65,000 people and a few bigger ones, but I included the ones that are available. Continue reading

Transportation & the Pandemic

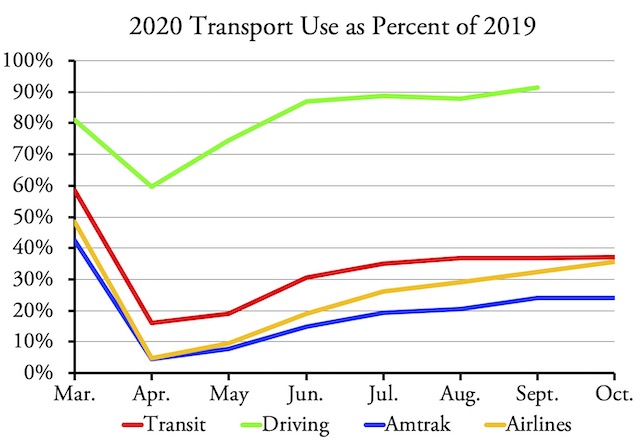
As noted here previously, Americans are driving at least 90 percent as much as they were before the pandemic, while transit ridership seems stuck at around 37 percent. The Federal Highway Administration hasn’t yet posted driving data for October, but I’ve used data from Amtrak monthly performance reports and the Transportation Security Administration to track what has happened to intercity rail and air travel.

As the chart shows, air travel is also at 37 percent but, unlike transit, it is growing. Amtrak slowly grew to 24 percent by September but remained there in October. Continue reading

A Billion Here, a Billion There . . .

The city of Honolulu has now officially admitted that completing its misbegotten rail transit project will cost more than $10 billion and that it won’t be done until 2033. When first proposed back in 2006, it was supposed to cost less than $3 billion and when construction began in 2013 it was supposed to begin operations early this year.

Although it will be completely elevated, leading the Federal Transit Administration to classify it as heavy rail, the trains Honolulu has purchased will only have the capacity of light rail. It is costing more per urban resident than any rail line in the world, yet it won’t be able to carry as many people per hour as a bus-rapid transit line.

Meanwhile, Denver’s Regional Transit District (RTD), which has suffered its own cost-overruns, is enthused about the idea of spending $2.5 billion for a 45-mph Front Range train from Ft. Collins to Pueblo. RTD’s own FasTracks rail project ended up costing more than twice as much as was promised to voters, forcing RTD to at least delay construction on a proposed line to Longmont.

When that line was at the stage that Front Range rail is at now, RTD estimated that it would cost $211 million. By 2008, the cost had risen to more than $700 million and the line was expected to carry so few riders that taxpayers would end up paying $60 a ride. Continue reading

What Infrastructure Crisis?
Bridges & Roads Are In Great Shape

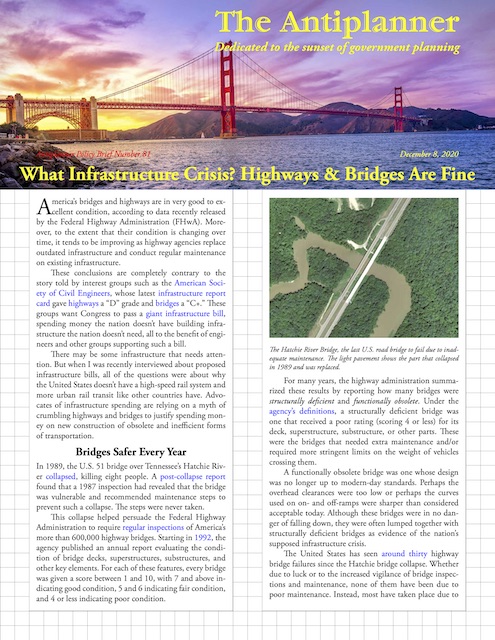
America’s bridges and highways are in very good to excellent condition, according to data recently released by the Federal Highway Administration (FHwA). Moreover, to the extent that their condition is changing over time, it tends to be improving as highway agencies replace outdated infrastructure and conduct regular maintenance on existing infrastructure.

Click image to download a four-page PDF of this policy brief.

These conclusions are completely contrary to the story told by interest groups such as the American Society of Civil Engineers, whose latest infrastructure report card gave highways a “D” grade and bridges a “C+.” These groups want Congress to pass a giant infrastructure bill, spending money the nation doesn’t have building infrastructure the nation doesn’t need, all to the benefit of engineers and other groups supporting such a bill. Continue reading

October Ridership Still Just 37% of 2019

Transit ridership in October 2020 was just 37.1 percent of October 2019 numbers, according to data posted Friday by the Federal Transit Administration. This is only a tiny improvement from September, when ridership was 36.9 percent of September 2019.

Despite the huge decline in ridership, transit agencies are still maintaining service at 75 percent of 2019 levels. Transit in the New York urban area, where ridership is down 62.4 percent, is running at 85 percent of 2019 levels. Agencies say they are doing this to allow for “social distancing,” but it is more likely that they are spending the money to keep union workers employed and to justify their parasitical existence.

Among major urban areas, the biggest change is in the San Francisco Bay Area, where ridership is just 23 percent of 2019 levels. At 25 percent, Washington is second followed by Boston, Sacramento, and San Jose, all of which are around 30 percent. Continue reading

$300 Million a Mile for 8-mph Transit

The United States is not the only country where transit agencies are spending far too much money building obsolete infrastructure. TransportNSW (for New South Wales) has spent AU$3.1 billion (US$2.3 billion) building a 12-kilometer (7.5-mile) South East light-rail line in Sydney that’s slower than buses making the same journey. For those who are counting, that’s more than $300 million a mile in U.S. dollars, putting it well above the average U.S. light-rail project.

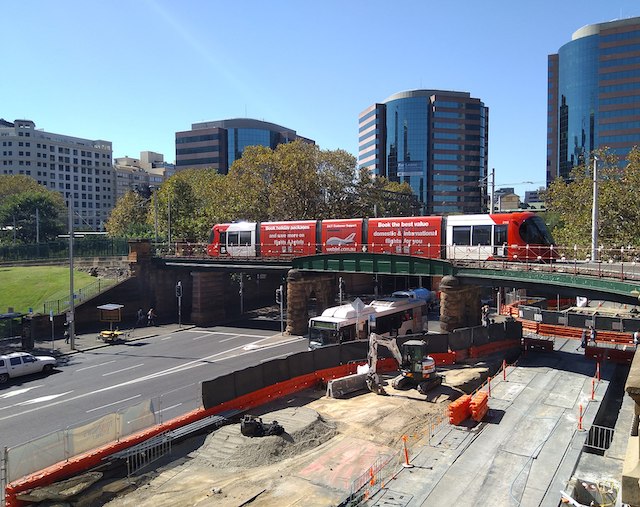
An existing (Dulwich) light-rail line crosses over the construction site for the South East in 2018. Photo by Gareth Edwards.

When first approved in 2014, the line was estimated to cost AU$1.6 billion. The project went through the usual cost overruns that nearly doubled the price. One reason was that the contractor hired to build the project successfully sued the New South Wales government, saying that the government had severely understated the amount of utility relocations that would be required during construction. The company won a settlement of AU$576 million. Continue reading