Oregon’s Mileage-Based Fee Program

CBS News reports on Oregon’s mileage-based user fee program, noting there is both support and opposition to the program. However, reporter Brook Silva-Braga notes that, not only that gas taxes aren’t working anymore, but that mileage-based fees can help relieve congestion.

Silva-Braka found someone who argued that charging user fees would hurt low-income people. But it would be better for low-income people to pay for what they use than to pay regressive taxes that often end up supporting programs used mainly by higher-income people. Continue reading

How San Jose Held Up Google for $200 Million

Last month, the San Jose city council approved a plan for Google to practically double the size of downtown San Jose. The plan allows Google to build up to 7.3 million square feet of office space, 4,000 to 5,900 housing units, 1,100 hotel/extended stay units, and half a million square feet of retail or cultural space on 80 acres of land located just west of downtown. The site is immediately adjacent to the San Jose train station, which serves commuter trains, light rail, and Amtrak.

Click image to download a four-page PDF of this policy brief.

According to city planning documents, this is exactly the kind of development San Jose was looking for in this area, one which (according to a staff presentation) would “create a vibrant, welcoming, and accessible urban destination consisting of a mix of land uses and that are well-integrated with the intermodal transit station.” Yet in order to get the project approved, Google had to put up $200 million for various special interest groups who were protesting the plan. This may actually have the perverse effect of discouraging future development in the city. Continue reading

Infrastructure Arithmetic

The White House and Senate Republicans have compromised on a $1.2 trillion infrastructure bill. Meanwhile, President Biden and Republican leaders have agreed to a $579 billion infrastructure bill.

Since $579 billion is less than half of $1.2 trillion, both of these statements can’t be true — and yet they are. The difference is that the $1.2 trillion includes “baseline spending,” or the amount that would have been spent on infrastructure even if no bill were passed. The actual infrastructure bill would only include $579 billion of new spending. That’s quite a concession on the part of the White House, which had originally proposed $2.3 trillion in new spending, or nearly four times as much as the bipartisan agreement. On the other hand, $579 billion is exactly $579 billion more than Republicans had proposed to spend before Biden released his original proposal on March 31.

At the same time, the so-called baseline appears to represent the amount that would be spent on surface transportation by the bill proposed by House Democrats, or about $78 billion a year. This is a large increase from the amount that has been spent in the past few years, which has been about $55 billion a year. In order to get the total above $1 trillion, allowing the president to save some face, the $78 billion a year is extended for eight years, even though the House bill would authorize only five years of spending. Continue reading

Restoring Transit Ridership

As the economy begins to open up, are any bars offering free beer to get you back as a customer? How about restaurants offering free food? Is the NFL giving away tickets to the next Super Bowl to insure it will have a live audience?

The answers to all of these questions are probably “no” because demand for these things actually exists. But transit agencies across the nation are offering discounted or even free fares to try to get riders back.

Unlike bars and restaurants, which were economically devastated by the lock-downs associated with the pandemic, transit is flush with cash thanks to a Congress that has been generous with other peoples’ money. That means it can afford to give such discounts, which translates to even greater subsidies to a transportation system that, before the pandemic, covered 78 percent of its expenses with taxpayer funds. Continue reading

Japan Maglev Controversy

Plans to build a maglev line between Tokyo and Nagoya may be threatened by local opposition. The proposed route would go through the Shizuoka prefecture, where people fear that a long South Alps Tunnel required for the train will affect their water supplies.

This famous scene of the Shinkansen in front of Mount Fuji is in Shizuoka prefecture. Photo by MaedaAkihiko.

Leading the opposition is Shizuoka Governor Heita Kawakatsu, who won re-election this week in a campaign where the rail line was a major issue. Kawakatsu represents a minority party while his opponent was endorsed by the Liberal Democratic party, which has been the majority party in Japan for many years. Continue reading

A Nation of Homeowners or Renters?

Somebody over at Bloomberg named Karl Marx, excuse me, Karl Smith, thinks America should become a nation of renters. Homeownership made sense, he says, when ownership costs were low relative to rent. But now, due to something he calls “financialization,” homeownership is too expensive, and so we should abandon the American dream of high levels of homeownership.

It may be self-serving for them to say so, but realtors are right to say that homeownership is a key to building wealth. Photo by Chris & Karen Highland.

Apparently, due to fast-rising home prices, private investors such as pension funds are buying homes and then renting them out. Homebuilders are even building homes with plans to rent them instead of selling them. Continue reading

Jane Jacobs and the Mid-Rise Mania

The next time you travel through a city, see if you can find many four-, five-, or six-story buildings. Chances are, nearly all of the buildings you see will be either low rise (three stories or less) or high-rise (seven stories or more). If you do find any mid-rise, four- to six-story buildings, chances are they were either built before 1910, after 1990, or built by the government.

Click image to download a five-page PDF of this policy brief.

Before 1890, most people traveled around cities on foot. Only the wealthy could afford a horse and carriage or to live in the suburbs and enter the city on a steam-powered commuter train. Many cities had horsecars—rail cars pulled by horses—but they were no faster than walking and too expensive for most working-class people to use on a daily basis. Continue reading

TransitCenter Says Transit Is Racist

The pro-transit TransitCenter has discovered something that the Antiplanner has been saying for years: transit policies are effectively racist. Many urban areas have “two-tiered transit systems,” says the TransitCenter’s Mary Buchanan, where an expensive form of transit, such as light or heavy rail, whisks high-income people, who are often white, to work while a cheaper, slower form of transit, such as local buses, trundles low-income people, who are often minorities, to their jobs.

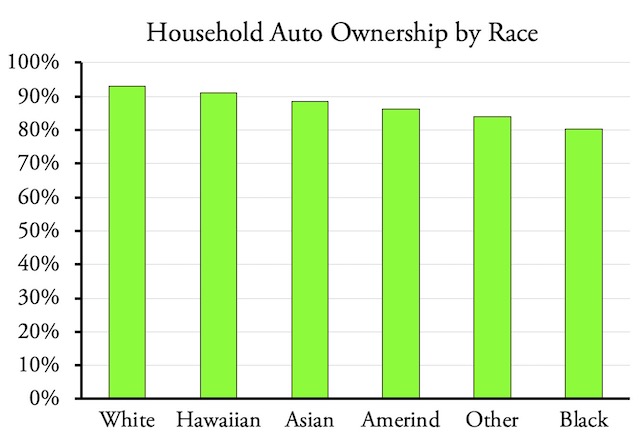
Black households have significantly lower auto ownership rates than whites. Source: American Community Survey table B25044. When broken down by race, the Census Bureau only has five-year data for 2011-2015; some auto ownership rates have probably improved since then. Census Bureau data also don’t breakdown Hispanic vs. non-Hispanic ownership rates; most Hispanics are included with whites.

Buchanan and her colleagues evaluated transit in major urban areas such as New York and Chicago and found that low-income people would be much better off owning a car than relying on transit to get to work, which is another thing the Antiplanner has been saying for years. Of course, the TransitCenter sees this as one more reason to increase transit subsidies, while I see it as a reason to encourage more car ownership. Continue reading

April Driving 92% of Pre-Pandemic Levels

Americans drove 256.5 billion vehicle-miles in April, 2021, according to data released yesterday by the Federal Highway Administration. That’s a 55 percent increase over April 2020 and just 8 percent short of April 2019. As a share of pre-pandemic driving, however, it fell short of March, which saw 262.6 billion vehicle-miles or 97 percent of pre-pandemic driving.

March 2021 had 23 business days while March 2019 had only 21, which probably accounts for some of the increase in driving. April 2021 and 2019 each had 22 business days. Transit also had a slight bump in March vs. April, though nowhere near as large as the 5 percent increase (when compared with April) for driving. Continue reading

The Vehicle Reliability Revolution

In 1970, the average car in the United States was 5.6 years old, and the average light truck was 7.3 years old. That meant that someone buying a car wouldn’t expect it to last much longer than 12 years, or 15 for light trucks.

Used car for sale. Photo by John Lloyd.

On Monday, a research group called IHS Markit announced that the average age of cars and light trucks has increased to 12.1 years. Data from the Bureau of Transportation Statistics indicates that cars have caught up with light trucks in the longevity sweepstakes, so someone buying either a car or light truck today can expect it to last close to 25 years. Continue reading