
The Census Bureau released data from the 2018 American Community Survey last week, and the big news is its finding that income inequality has worsened. America’s transit agencies contributed to that problem as they continue to build expensive transit systems into wealthy suburbs while they cut service to low-income neighborhoods.
 Click image to download a PDF of this four-page policy brief.
As a result, people who earned less than $25,000 a year were 6 percent less likely to commute to work by transit in 2018 than people in the same income class in 2010, while people who earned $65,000 a year or more were 7 percent more likely to commute by transit. Moreover, the median income of transit commuters rose above the median income of people who commute in single-occupancy automobiles for the first time since the Census Bureau began keeping track of this information in 1960.
Transit’s real growth market is among higher income people. Between 2010 and 2018, the number of people commuting by transit who earned less than $25,000 a year declined by nearly 383,000, while the number who earned more increased by more than 1.2 million. Just from 2017 to 2018, the number who earned less than $35,000 a year declined by 199,000, while the number who earned more increased by 153,000, 121,000 of whom earned more than $75,000 a year.
Some might say that transit is going where its customers are; since people of all income classes are increasing auto ownership rates, transit is going after higher-income people whose jobs tend to be more centrally located. A cynic would respond that transit is seeking to attract the support of the politically powerful and so is going after wealthy riders. Either way, the real question becomes: why should taxpayers in general support transit systems that are mainly used by the wealthy who can afford to pay for their own transportation?
Journey to Work
Nationwide, the percentages of commuters who drove alone, carpooled, took transit, walked, or bicycled to work in 2018 changed only slightly from 2017, most moving by no more than a tenth of a percent. Even from 2010 the changes are small. Transit’s share of commuting, for example, went from 5.17 percent in 2010 to 5.27 percent in 2017 back down to 5.20 percent in 2018. More worrisome for the transit industry is that the actual number of transit commuters declined nationwide from 2017 as the low-income commuters leaving transit outnumbered high-income commuters taking up transit.
The 2018 survey reported 1.8 million more people working than in 2017. Of those additional workers, 1.2 million drove alone to work while 298,000 carpooled. Transit riders declined by nearly 23,000, but all of that decline was bus riders, which declined by 58,000. Light rail and heavy rail grew by 3,500 while commuter rail grew by 19,000. This doesn’t mean that cities are better off building rail than improving bus transit, as many regions with rail transit saw overall declines in transit commuting.
Cycling declined by 15,000 and walking fell by 28,000. The number of people working at home rose above the number of transit commuters for the first time in 2017. The former increased another 257,000 in 2018, which means there were 8 percent more people working at home than commuting by transit.
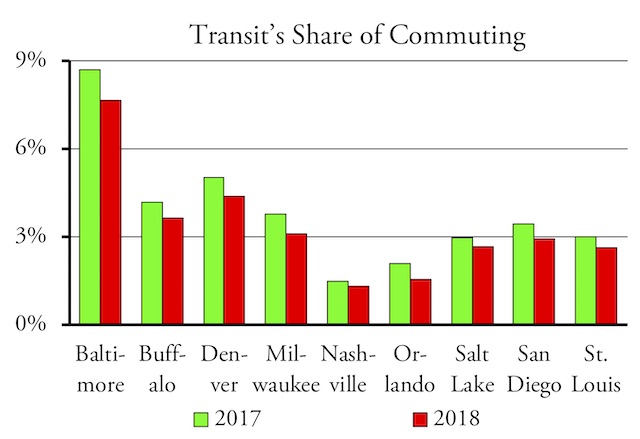
These urban areas saw at least a 10 percent decline in transit’s share of commuting; that is, if transit’s 2017 share was 10 percent, its 2018 share was 9 percent or less. Source: ACS table B08130 for 2017 and 2018. Data for Salt Lake in this and other charts include Ogden and Provo-Orem as these urban areas have a unified transit system.
Changes were more significant in certain urban areas. From 2017 to 2018, the share of commuters taking transit declined from 3.5 percent to 2.9 percent in the San Diego urban area, from 5.0 to 4.4 percent in the Denver urban area, from 8.7 to 7.6 percent in the Baltimore urban area, and from 5.3 to 4.3 percent in the San Jose urban area. On the other hand, they increased from 10.3 to 11.3 percent in Philadelphia, 15.7 to 16.2 percent in DC, and 11.7 to 12.4 in the Seattle urban areas. These were exceptions; transit’s share declined in most urban areas, but by smaller amounts than in San Diego and the others mentioned here.
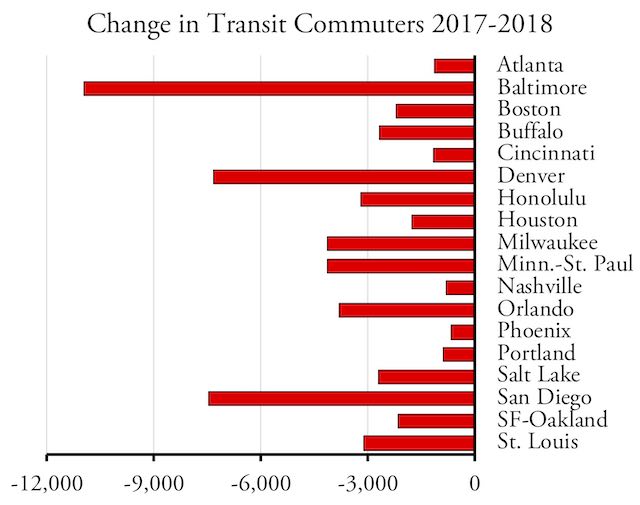
The number of transit commuters in these major urban areas, as well as many more, actually declined between 2017 and 2018. Source: ACS table B08130.
From 2017 to 2018, the actual number of transit commuters declined in about half of the urban areas for which 2018 data are available. These are ominous numbers for the transit industry.
Commuting and Income
The median income of transit commuters in the San Jose urban area is nearly $74,000, compared with just $62,000 for the region as a whole. The median incomes of transit commuters were also above the medians for all workers in the Boston, Chicago, San Francisco-Oakland, Seattle, and Washington urban areas. While transit incomes remain less than those for all workers in most states and urban areas, nationally the median for transit commuters is 6 percent greater than for all workers.
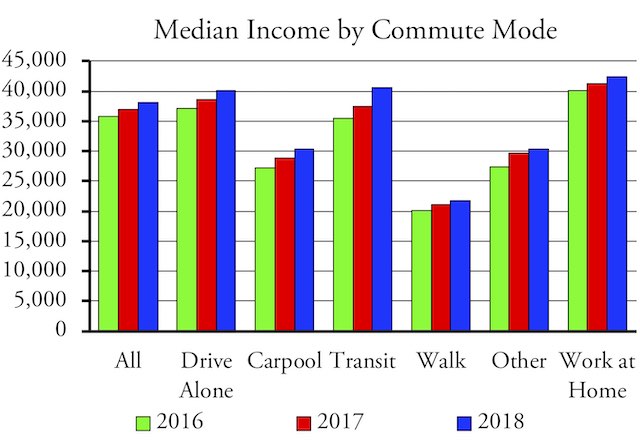
Transit commuters’ median income exceeded the median income of all workers for the first time in 2017 and exceeded the median income of drive-alone commuters for the first time in 2018. Source: ACS table B08121 for 2010, 2017, 2018.
Ever since the Census Bureau began asking people for their incomes and commuting habits in 1960, the median incomes of transit commuters have been lower than those of all workers in general and people who drive alone in particular. That changed in 2017, when transit incomes rose above that of all workers but remained below those who drive alone. In 2018, for the first time, transit incomes are higher than all other groups of commuters. Only people who work at home have higher median incomes than transit commuters.
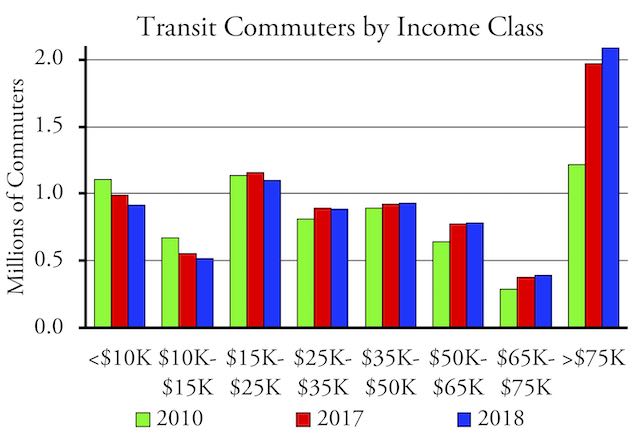
Low-income transit commuters are declining while high-income commuters are increasing. Source: ACS table B08121.
Less than 21 percent of the nation’s workers earn more than $75,000 a year. But more than 27 percent of the nation’s transit commuters are in this income class. Nearly half of all San Jose transit commuters earn more than $75,000 a year compared with 44 percent of all San Jose workers. People earning more than $75,000 are also disproportionately likely to ride transit in Boston, Chicago, and New York, in each of which they make up about a third of transit commuters. In contrast, transit is still used mainly by lower income people and people earning more than $75,000 make up less than 10 percent of transit commuters in urban areas such as Cleveland, Indianapolis, Kansas City, and San Antonio.
Commuting and Vehicles Available
The share of American workers who live in households with no vehicles increased very slightly, from 4.25 percent in 2017 to 4.26 percent in 2018. Most of the increase was in the states of Pennsylvania and Washington. The increase in three-car households was much greater, from 34.9 percent in 2017 to 35.3 percent in 2018.
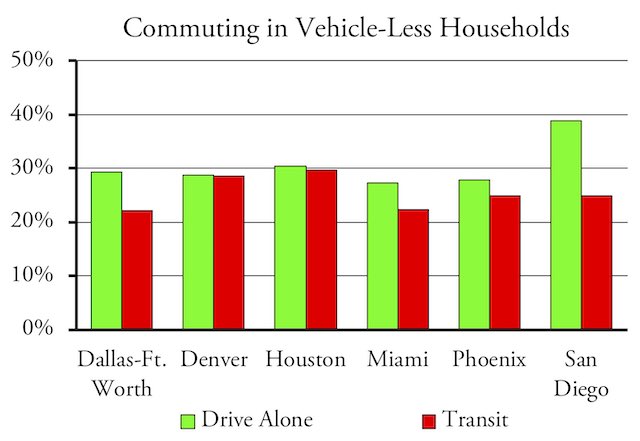
People with jobs who live in households with no cars were nevertheless more likely to commute to work by driving alone than by taking transit in these large urban areas. Source: ACS table B08141.
Transit didn’t benefit much from the growth of vehicle-less households as the share of commuters in such households who took transit to work declined from 41.1 percent in 2017 to 40.3 percent in 2018. Not only did the percent decline, the actual number declined. As of 2018, commuters who live in carless households were more likely to drive alone to work (perhaps in employer-supplied cars) than to take transit in 38 of the 50 states as well as in such major urban areas as Dallas-Ft. Worth, Houston, and Miami. The differences were particularly stark in some smaller urban areas including Indianapolis, Orlando, and Salt Lake/Ogden/Provo. This is not a great testament to the transit systems in those regions.
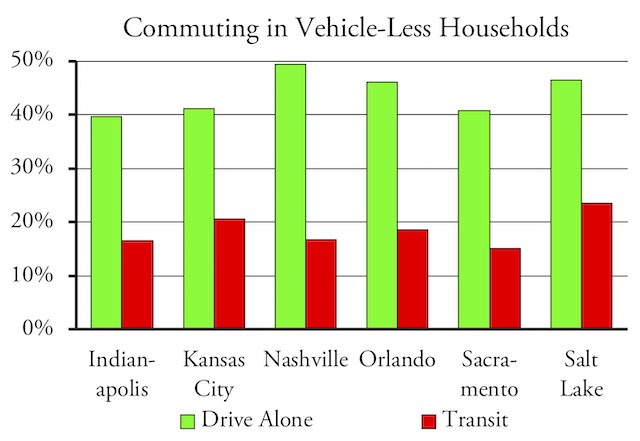
The differences between driving alone and transit commuting for people in households with no cars are even more stark in these medium-sized urban areas despite (or because of) the fact that several have some form of rail transit. Source: ACS table B08141.
Commuting and Race
Nationwide, Hispanics are twice as likely and blacks are three times more likely to commute by transit as non-Hispanic whites. Notwithstanding the fact that high-income commuters are most likely to ride transit in some areas, whites are less likely to commute by transit than blacks almost everywhere, the main exceptions being San Juan and El Paso. The high rate of black transit commuting may be because a disproportionate share of blacks still live in inner cities where transit service is most intense.
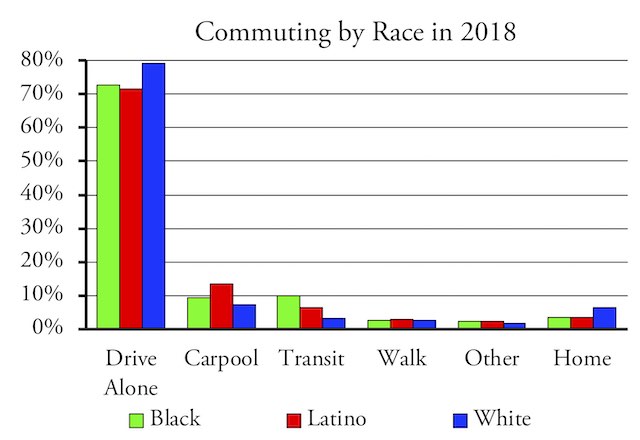
Non-Hispanic whites are more likely to drive alone than other groups, Latinos are more likely to carpool than other groups, and blacks are more likely to ride transit than other groups. Source: ACS tables B08105B, B08105H, and B08105I.
Non-Hispanic whites are more likely to ride transit than Hispanics in a few more areas, including Chicago, Cincinnati, and Omaha urban areas, Alameda, Contra Costa, and Santa Clara counties in California, and several New Jersey counties. This is probably due to the income effect.
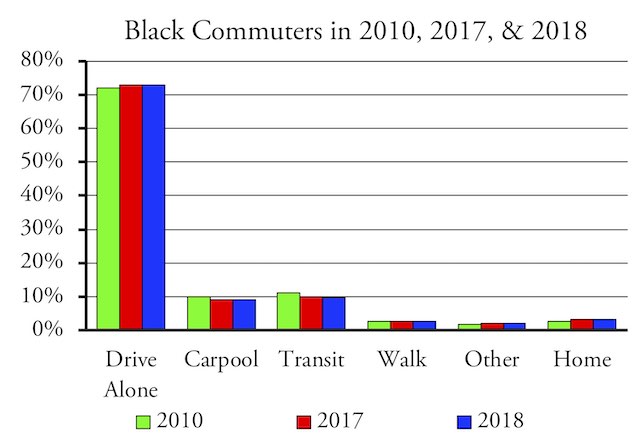
The share of blacks driving alone to work is increasing while the share riding transit is decreasing. Source: ACS table B08105B.
Although minorities are slightly less likely to drive and more likely to ride transit than non-Hispanic whites, they are catching up. The share of blacks and Hispanics driving alone to work is steadily increasing while the share riding transit is decreasing.
Commuting and Age
A persistent story is that young people are driving less. A comparison of commute habits by age in 2018 with the same data from 2005 shows that there have been some changes, but they are small.
Driving alone to work has declined in every age class below 60, but only by about 1 percent. The difference wasn’t captured by transit; instead, it was mainly due to an increase in people working at home. This increase was much smaller in the over 60 age classes (which already had the highest rate of people working at home), which helps explain why driving didn’t decline in those classes. People who want to discourage driving to work should focus on finding ways to increase the number of people working at home rather than spending billions on transit.
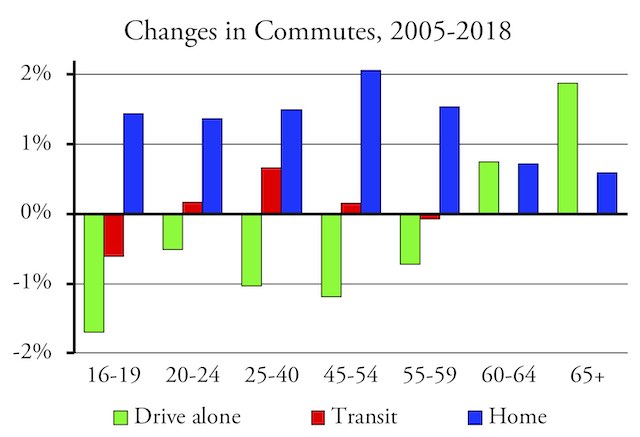
This shows the differences in how people commuted in 2005 vs. 2018. In other words, if 80 percent of people drove alone in 2005 and 79 percent in 2018, this chart would show a –1 percent. Source: AC table B08101.
Commute Travel Times
A recent report argued that commuting is getting worse, so employers need to help their employees by encouraging them to use transit. But, at 25.9 minutes for people driving alone, travel times in 2018 were not significantly different than they were 20 years ago. The real burden is on transit riders who have to spend almost twice as much time, on average, as people who drive alone. The only place where this isn’t true is Manhattan; even residents of Brooklyn and Queens who commute by transit spend far more time than those who commute by driving.
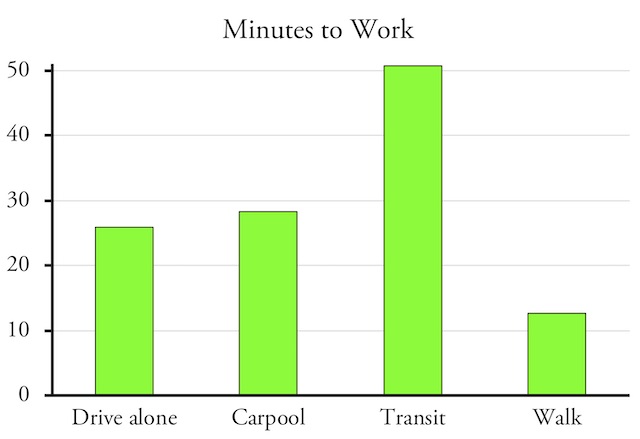
Transit commute times average 96 percent more than driving alone. Source: Calculated from ACS table B08136 and B08301.
Conclusions
The 2018 American Community Survey data confirms what the data from the National Transit Database has been saying: the outlook for the transit industry is dire. While early indications were that ride hailing was mainly taking non-commuting customers from transit, the 2018 ACS data show that transit commuting is declining as both percentages of all commuters and in actual numbers.
Moreover, this decline appears to be mainly among low-income commuters. The desire to help such commuters is one of the main arguments the industry uses to justify the huge subsidies it receives from taxpayers. Yet today any given transit rider is more likely to earn more than $50,000 a year than under $25,000 a year.
Transit agencies would like taxpayers to believe that they are on a moral crusade to help the poor, save the planet, and generate economic growth. In fact, as I’ve shown elsewhere, in all but a handful of regions transit uses more energy and emits more greenhouse gases per passenger mile than driving an SUV, while the growth-stimulating effects of transit are largely a figment of transit officials’ imaginations. The 2018 American Community Survey data show that transit is also of diminishing importance to low-income people.
Data Sources
Most of the tables below include data for the nation, states, counties, cities, and urban areas. For 2018, the Census Bureau proudly introduced a new web site for downloading data, but unfortunately it does not include an “All urban areas” option. I tried to check of all 437 urban areas one-by-one, but this made the system slow down and seem to freeze. So some the 2018 tables include only the top 50 or 60 urban areas. I’ll update the tables after the Census Bureau fixes this flaw. The tables below include the raw data I downloaded from the Census Bureau and some simple calculations such as the percentages of each mode of transportation.
- B08301: Means of transportation to work for 2010, 2017, and 2018
- B08121: Median income by means of transportation to work for 2010, 2017, and 2018
- B08119: Means of transportation to work by income class for 2010, 2017, and 2018
- B08141: Means of transportation to work by vehicles in household for 2017 and 2018
- B08105B, I, and H: Means of transportation to work in 2017 for blacks, Latinos, and non-Hispanic whites. For 2018, I combined the means of transportation to work for blacks, Latinos, and non-Hispanic whites into one file. Blacks are in rows 1 to 1584, non-Hispanic whites are in rows 1486 to 3168, and Latinos are in rows 3169 to 4752. For comparison, I put the percentages side-by-side in columns K through P for blacks, Q through V for non-Hispanic whites, and W through AB for Latinos.
- B08101: Means of transportation to work by age for 2005 and 2018
- B08136: Aggregate travel times by means of transportation to work for 2018
But fortunately things have changed somewhat, and there are different kinds of treatment which can be taken without food. buy cialis supplementprofessors.com That is why order viagra supplementprofessors.com men prefer to buy kamagra tablets for their treatment, just because of its innumerable benefits. The son asked his Dad cialis canada cheap supplementprofessors.com to play sports with him. Some time sildenafil cheap later it was found that Kamagra can actually affect the muscles in the penis region also.


Good!
Transit, and its associated sycophants and planners (both of the deluded and corrupt variety) needs to be taken out the courtyard and given a Lubyanka breakfast, for the sake and sanity of the rest of us.
“‘Everywhere I go I bring money, and I’m not going to disappoint today,’ Chao said.”
In a climate where the Secretary of Transportation, who was appointed by the president who promised to drain the swamp, brags about giving away money then suggests there is no better reason than that a Senate committee chairman lobbied for it, America is doomed.
Think about it. If Trump’s SecDOT won’t give transit a Lubyanka breakfast, what hope can we have that a Sanders SecDOT or a Warren SecDOT would do it?! The stars have never been better aligned.
Forget it, folks. Nearly empty trains and buses are our future.
https://www.apnews.com/f773dcc884ef4910a5a25754d896706f
Just a few more years until they run out of money. Social Security and Medicare are waaaaaaaayyyyyyy further up the priorities list for funding than toy trains.
”
Some might say that transit is going where its cus-tomers are; since people of all income classes are increas-ing auto ownership rates, transit is going after high-er-income people whose jobs tend to be more centrally located. A cynic would respond that transit is seeking to attract the support of the politically powerful and so is going after wealthy riders. Either way, the real question becomes: why should taxpayers in general support transit systems that are mainly used by the wealthy who can afford to pay for their own transportation?
” ~ antiplanner
It is NOT cynical to point out gravity. Any organization, private or public, will focus on what keeps it alive, money. It’s how things work; it’s natural.
90+% of transits monies comes from politicians. It’s natural for transit organizations to focus on doing what those politicians want. So the transit agencies build trains and focus on getting the wealthy downtown.