Cost Overruns and Ridership Shortfalls

Rail transit projects built in the United States typically suffer severe cost overruns and end up carrying far fewer riders than originally projected. The latest studies published by the Federal Transit Administration (FTA) indicate that the projections made for some recent projects are better than those made in the past. However, this is partly because the FTA has changed its definition of “cost overrun” and partly because the FTA has not yet looked at some projects that we know have huge overruns, such as the Honolulu rail project.

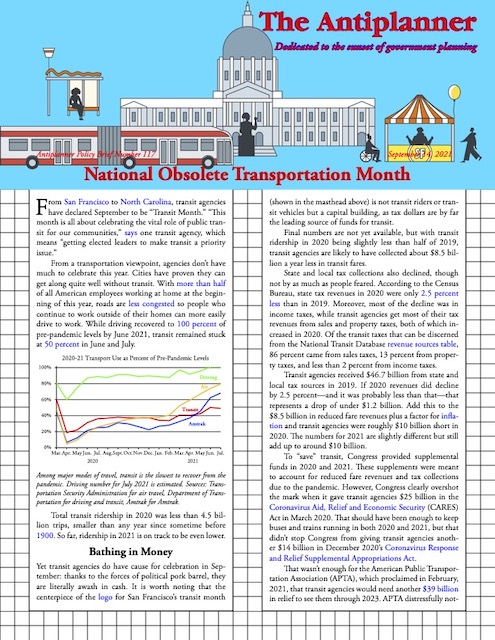
Click image to download a five-page PDF of this policy brief.

The Department of Transportation first looked at this issue in a 1990 report by Don Pickrell, who looked at four heavy rail, four light rail, and two automated guideway (“people mover”) projects in nine cities. On average, Pickrell found, building these projects ended up costing 62 percent more than projected, operating them cost 130 percent more than projected, and ridership was 47 percent less than projected. Continue reading

Transit Workers Overpaid

Transit workers in many cities get paid more than twice as much as private sector employees working in transportation, according to a new report from the Heritage Foundation. The report compared average pay by major transit agencies in Atlanta, Chicago, New York, Philadelphia, San Francisco, and Washington with the average pay for all workers and the pay for transport workers in those regions.

Transit Premium Over Other Workers in Same Region

CityAll WorkersTransport Workers
Atlanta11.7%58.8%
Chicago31.4%77.1%
New York50.1%27.1%
Philadelphia39.7%109.7%
San Francisco61.0%147.8%
Washington31.5%121.1%

As shown in the table, Heritage Foundation researcher David Ditch calculated that average transit pay is anywhere from 12 to 61 percent greater than average pay for all workers in these regions and 59 to 148 percent more than average pay for transport workers. There are a couple of caveats, however. Continue reading

May Driving Reaches 96% of Pre-Pandemic Levels

Americans drove 95.6 percent as many miles in May 2021 as they did in May 2019, according to data released by the Federal Highway Administration yesterday. This is up from 91.9 percent in April but down from 97.2 percent in March. May’s record is pretty good considering that May had two fewer business days in 2021 than in 2019 while March had two more.

At 99.4 percent of pre-pandemic levels, rural driving is ahead of urban driving, which was just 93.9 percent in May. Drivers in 21 states drove more in rural areas in 2021 than in 2019; urban driving in May 2021 exceeded 2019 in just six states. Continue reading

Reinventing Transit for a Post-COVID World

As society rebuilds after the pandemic, the transit industry at a crossroads. It could totally reinvent itself to truly serve the residents of modern cities. Alternatively, it could come up with new reasons for ever larger subsidies despite continuing to be ineffective and wasteful. Since President Biden and Democrats in Congress seem eager to give it subsidies with few to no questions asked, it is likely to choose the latter course.

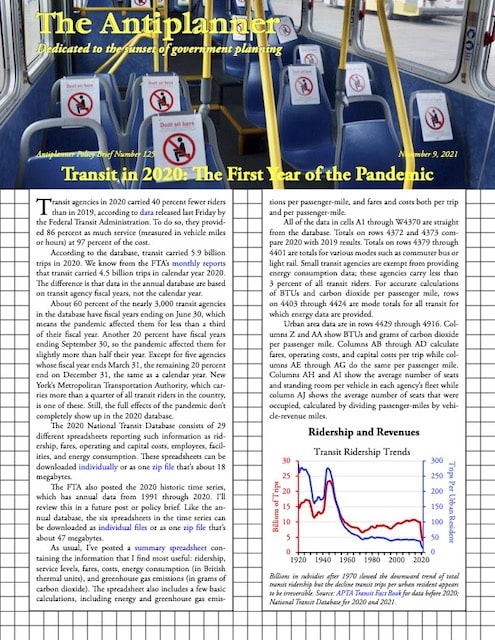
Click image to download a five-page PDF of this policy brief.

Transit ridership has declined steadily since 2014, losing 7.7 percent nationally between 2014 and 2019. During that time, transit ridership declined in about 85 percent of the nation’s major urban areas. On a larger scale, it has been declining for the last century, with per capita ridership falling from nearly 290 trips per urban resident in 1920 to just 37 in 2019. As of April, 2021, ridership was 60 percent lower than it had been before the pandemic, and it isn’t clear that ridership will ever recover to 2019’s already low levels. Continue reading

Transit’s Post-COVID Recovery Is Slowest

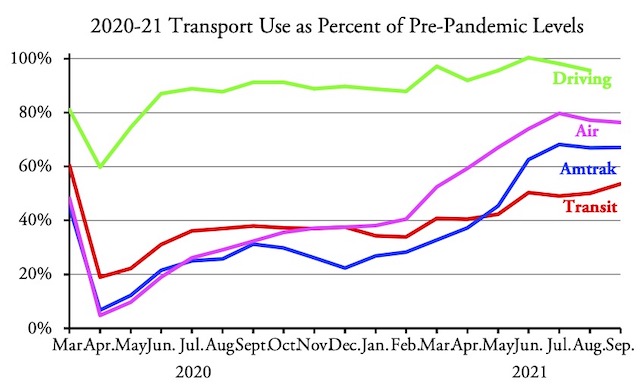
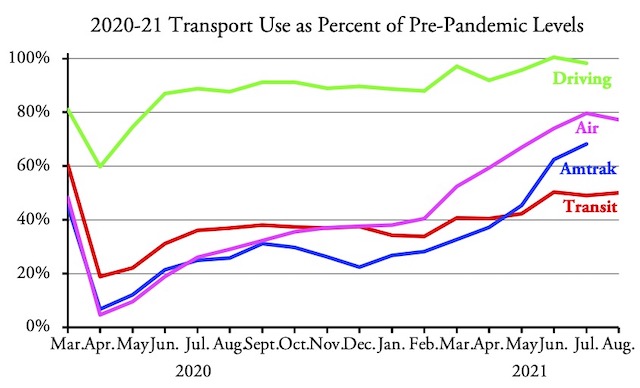
Amtrak’s May ridership surged to 45.2 percent of pre-COVID levels (as compared with May 2019), surpassing public transit, which reached only 42.3 percent of 2019 levels. Transit’s recovery was partly hurt by the fact that May 2021 had two fewer business days than May 2019, but the slow growth makes transit the least-recovered of the various modes of travel.

Shown are transit trips from the National Transit Database, and airline trips from Transportation Safety Administration, and Amtrak passenger miles from the May performance report. Driving is in vehicle miles from the Federal Highway Administration’s Traffic Volume Trends; May highway data won’t be out for another week or so.

As usual, rail transit is doing worse than bus transit when compared with 2019, but rail has also recovered more since 2020. Most of rail’s recovery is in heavy rail and commuter rail; light rail’s recovery is only slightly faster than transit buses and hybrid rail (meaning Diesel-powered light rail) isn’t even recovering as fast as buses. Continue reading

Restoring Transit Ridership

As the economy begins to open up, are any bars offering free beer to get you back as a customer? How about restaurants offering free food? Is the NFL giving away tickets to the next Super Bowl to insure it will have a live audience?

The answers to all of these questions are probably “no” because demand for these things actually exists. But transit agencies across the nation are offering discounted or even free fares to try to get riders back.

Unlike bars and restaurants, which were economically devastated by the lock-downs associated with the pandemic, transit is flush with cash thanks to a Congress that has been generous with other peoples’ money. That means it can afford to give such discounts, which translates to even greater subsidies to a transportation system that, before the pandemic, covered 78 percent of its expenses with taxpayer funds. Continue reading

TransitCenter Says Transit Is Racist

The pro-transit TransitCenter has discovered something that the Antiplanner has been saying for years: transit policies are effectively racist. Many urban areas have “two-tiered transit systems,” says the TransitCenter’s Mary Buchanan, where an expensive form of transit, such as light or heavy rail, whisks high-income people, who are often white, to work while a cheaper, slower form of transit, such as local buses, trundles low-income people, who are often minorities, to their jobs.

Black households have significantly lower auto ownership rates than whites. Source: American Community Survey table B25044. When broken down by race, the Census Bureau only has five-year data for 2011-2015; some auto ownership rates have probably improved since then. Census Bureau data also don’t breakdown Hispanic vs. non-Hispanic ownership rates; most Hispanics are included with whites.

Buchanan and her colleagues evaluated transit in major urban areas such as New York and Chicago and found that low-income people would be much better off owning a car than relying on transit to get to work, which is another thing the Antiplanner has been saying for years. Of course, the TransitCenter sees this as one more reason to increase transit subsidies, while I see it as a reason to encourage more car ownership. Continue reading

The Gullibility Multiplier

A recent report published by the Transit Cooperative Research Program (TCRP) concluded that transit reduces greenhouse gas emissions. How can this be when (as the Antiplanner has shown) data published by the Departments of Transportation and Energy show that transit emits as much or more greenhouse gases per passenger mile as the average car?

Easy! The authors of the TCRP paper, using the same data I used, found that transit emitted as much or more greenhouse gases per passenger mile as the average car. They also admitted that without transit, only “33 percent of transit passenger miles would otherwise be replaced by personal vehicle miles,” which means transit is three times worse than driving.

However, they then introduce two magic numbers that, when combined with transit’s real emissions, allow them to make it appear that transit is saving huge amounts of total emissions. The first magic number is called the land use efficiency multiplier. It assumes spending money on transit would lead to land-use changes that would in turn lead people to drive less, including people who don’t ride transit. The second magic number is called the transit efficiency multiplier, and it assumes that people who ride transit, say, 100 miles a week avoid several hundred miles of weekly driving. Continue reading

Transit & Amtrak Lag Behind Driving & Flying

Transit carried 40.5 percent as many riders in April, 2021 as in April, 2019, according to data released by the Federal Transit Administration last Friday. This is a slight step backwards from March, in which transit carried 40.8 percent as many people as in March 2019.

As indicated by the dotted line, driving data are not yet available, but a future Antiplanner post will update this chart when they are published.

Amtrak was even worse, carrying 37.2 percent of its 2019 passenger-miles, according to the company’s monthly performance report. This, however, was a bigger improvement over March, when it carried 32.7 percent of 2019 passenger-miles. Continue reading

No Light Rail for You, San Jose

After last week’s shooting, restoring light-rail service to Silicon Valley will take “weeks or months, not days,” says a representative of the Santa Clara Valley Transportation Authority (VTA). In place of light rail, the agency was providing “bus bridges” to serve light-rail routes.

On Monday, however, VTA announced that it would discontinue such bus bridges. Instead, it “is directing all resources to the regular bus network that serves the majority of our riders who rely on public transit the most.” In other words, light rail serves mainly high-income workers who aren’t riding anyway because they are working at home. So those who were still riding light rail before last Wednesday must hustle to find alternate transportation such as riding buses that don’t necessarily parallel the light-rail lines.

If these light-rail lines were so important to the region that they had to be built, it seems like they would be important enough to keep running buses serving their customers while the rail system is out of commission. VTA is tacitly admitting that it was a mistake to build them in the first place. Continue reading