Bay Area Arrogance

The Bay Area Rapid Transit District (BART) has seen ridership fall in every year since 2015. The district was originally created to bring office workers from the suburbs into downtown San Francisco, yet downtown is now a ghost town with some of the highest vacancy rates in its history and actual occupancy rates — that is, offices that are actually being used — are probably below 20 percent. BART’s latest ridership numbers themselves are less than 15 percent of 2019 levels. Many of San Francisco’s high-tech employers have already announced that they will allow many of their employees to continue to work from home after the pandemic.

What better time is there for BART to announce its proposal to significantly expand its service? Called Link 21, the heart of the proposal is to build a second tube under the bay connecting San Francisco with Oakland costing a mere $30 billion. Continue reading

The $25 Billion Theft

The states siphoned off 21 percent of gasoline taxes and other highway user fees to pay for mass transit and other non-highway activities in 2019, according to table SDF of the 2019 Highway Statistics, which was posted this week by the Federal Highway Administration. The table shows that $9.8 billion in highway user fees were spent on transit and $15.1 billion were spent on other non-highway activities for a total of nearly $25 billion out of the $120 billion collected by the states from highway users.

State diversions of highway user fees to non-highway programs grew rapidly after 1980.

In terms of total dollars, the worst offender was Texas, which spent more than half of the user fees it collected, nearly $6.5 billion, on education and other non-highway activities. Transit received an insignificant portion of Texas’ highway revenues. Continue reading

November Ridership Down 63 Percent

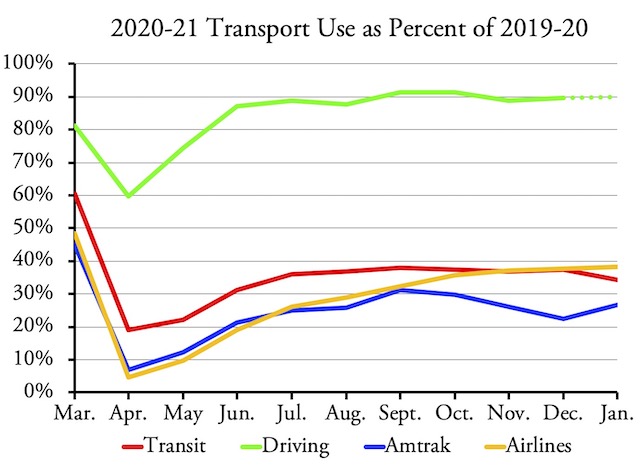
Transit ridership in November 2020 was 63.1 percent less than in 2019, according to data released yesterday by the Federal Transit Administration. That was down from October, which was 62.7 percent less than in 2019, and September, which was 62.0 percent less than in 2019. These numbers are preliminary as a few agencies may not have submitted their November ridership numbers in time for this report, but ridership has been stuck at around 37 percent of 2019 numbers since July.

While private businesses have scrambled to cut costs in response to the pandemic, transit agencies continue to operate at 80 percent of 2019 levels. Agencies, of course, received a $25 billion bailout from Congress in April. Since total transit fares were only about $16 billion in 2019, most of this bailout was predicated on the assumption that the state and local taxes that transit agencies rely on would significantly drop due to the pandemic and associated shutdowns.

In fact, state and local tax revenues in the first nine months of 2020 were just 1 percent less than in the same period in 2019. While we don’t yet have exact data for transit systems, it seems likely that transit agencies were awash with cash in 2020 due to the huge federal bailout. This allowed them to maintain service at 80 percent of 2019 levels despite losing more than half of their riders over the year. Continue reading

RTD Violated Stay-at-Home Orders

Denver’s Regional Transit District lost 68 percent of its riders last April due to Colorado’s stay-at-home orders. Rather than obey the orders, some of RTD’s staffers visited some of the so-called transit-oriented developments along its rail lines and found — gasp! — 40 to 50 percent of the parking spaces were empty. They concluded that those parking spaces were a waste and should be taken away, perhaps filled with more mid-rise housing.

What time of day would you count spaces in an apartment parking lot to see how many were needed? RTD picked 10 am to 3 pm. Photo by Bearas.

According to RTD’s report, they did the parking lot counts between 10 am and 3 pm in the middle of a week in April. RTD’s reasoning seems to be that, since everyone was supposed to stay at home, any empty spaces meant that no one really needed those spaces. Continue reading

Transit Gets $14 Billion in Relief

The transit industry will get $14 billion of the $900 billion coronavirus relief package passed by Congress on Tuesday. That’s less than half of what transit agencies wanted but enough to tide them over for five months or so by which time (the agencies hope) the next Congress will have a chance to pass another and even bigger relief bill. The $14 billion is on top of the $13 billion that Congress gave to transit as a part of its normal annual funding bill.

For those who care, the TransitCenter has posted a spreadsheet showing its estimate of how the $14 billion in relief funds will be distributed among the nation’s major urban areas. The New York urban area will get $5.5 billion of which $3.9 billion goes to New York, $1.4 billion goes to New Jersey, and $0.2 billion to Connecticut.

Los Angeles gets nearly a billion, San Francisco-Oakland $800 million, and Chicago and Seattle around half a billion. Curiously, what regions get isn’t closely related to how many transit riders they carry: Seattle apparently will get 16 percent more than Chicago even though Chicago transit carries more than twice as many riders as Seattle’s. Continue reading

Ten Reasons Why Transit Parity Is a Bad Idea

From the Department of Bad Ideas for Transportation (DOBIT) comes a new one: transit parity, which means the federal government should spend as much money on transit as it spends on highways. This compares to the current system where about three times as many federal dollars are spent on highways as on transit. While transit parity is right up there with free transit when measured on the idiocy scale, at least 33 members of Congress have signed onto a transit parity resolution.

Click image to download a four-page PDF of this policy brief.

Since this issue is likely to be raised in a Biden-led Democratic Congress, here are ten reasons why it is a bad idea. Some of these reasons are obvious, but this policy brief will provide details most people might not have. Other reasons have been mentioned in past policy briefs, yet they are worth repeating just to counter the nonsense that is so often repeated by transit advocates. Continue reading

Plotting Transit’s Demise

A new website designed to help people plot the demise of public transit has been posted and is being publicized by, of all groups, the American Public Transportation Association (APTA). To be fair, by “plot” I don’t mean “scheme” but “make a graph.”

Click image for a larger view.

The web site makes graphs showing weekly ridership for the nation or for any region or transit agency. Graphs can show the last four, 13, 26, or 52 weeks. Users can also access data showing ridership in the last 52 weeks either in absolute numbers or as a percentage of the same week from the year before. Continue reading

Roads Carried 98.4% of Urban Travel in 2019

Motorized travel, that is; we don’t have good numbers for walking and cycling. However, in continuing its incremental publication of Highway Statistics 2019, the Federal Highway Administration yesterday posted miles of driving and other data for the nation’s 495 urban areas. Since transit passenger miles for each of the urban areas are in the National Transit Database, we can calculate transit’s share of motorized travel.

To do this, I’ve created a slightly enhanced spreadsheet for table HM-72. First, I put all of the urban areas on one worksheet; the FHwA version divides them into seven worksheets, which can make it hard to find some of the smaller urban areas.

Second, I updated the population data using the Census Bureau’s 2019 estimates; I think the population numbers in HM-72 are based on the 2010 census. Unfortunately, the Census Bureau doesn’t seem to have yet calculated population numbers for most urban areas with under 65,000 people and a few bigger ones, but I included the ones that are available. Continue reading

October Ridership Still Just 37% of 2019

Transit ridership in October 2020 was just 37.1 percent of October 2019 numbers, according to data posted Friday by the Federal Transit Administration. This is only a tiny improvement from September, when ridership was 36.9 percent of September 2019.

Despite the huge decline in ridership, transit agencies are still maintaining service at 75 percent of 2019 levels. Transit in the New York urban area, where ridership is down 62.4 percent, is running at 85 percent of 2019 levels. Agencies say they are doing this to allow for “social distancing,” but it is more likely that they are spending the money to keep union workers employed and to justify their parasitical existence.

Among major urban areas, the biggest change is in the San Francisco Bay Area, where ridership is just 23 percent of 2019 levels. At 25 percent, Washington is second followed by Boston, Sacramento, and San Jose, all of which are around 30 percent. Continue reading

Let the Banks Pay for the Subway

Everyone knows that New York City is the heart of the United States, Manhattan is the heart of New York City, and the subways are the arteries that keep that heart pumping. Thus, when the Metropolitan Transportation Authority (MTA) warns that it will have to make “doomsday cuts” if Congress doesn’t give it another $12 billion, and that such cuts would “devastate the city for years to come,” people listen.

At the same time, New York officials say that subway riders should not have to suffer any fare increases to keep the system running. After all, the whole country benefits, so why should the lowly subway riders have to pay the full cost of their rides?

But who really benefits from the New York City subway? The extensive subway network has allowed Manhattan to grow to and maintain population and job densities found nowhere else in the country. So Manhattan property owners benefit, but how does that benefit the rest of the country? Six years ago, the land alone in Manhattan was estimated to be worth more than $1.7 trillion, which is more than $120 million an acre, and a considerable portion of this value is due to the subway system. Continue reading