December Transit 77.3% of Pre-Pandemic Ridership

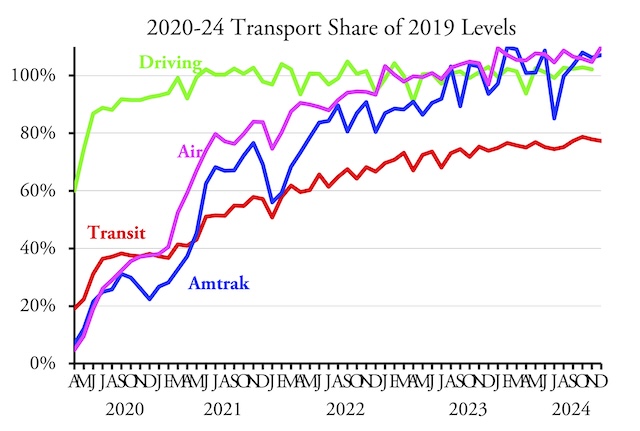
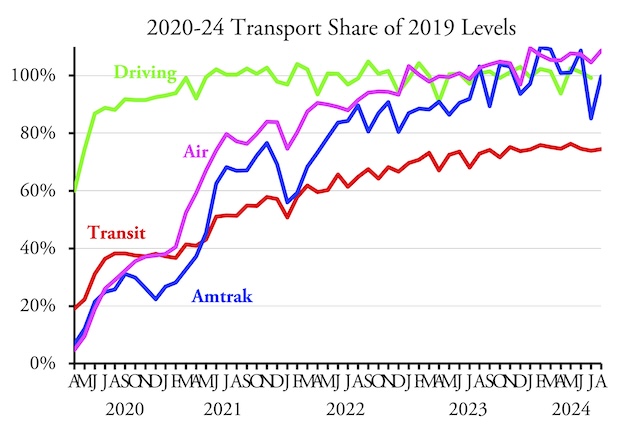
Transit carried 77.3 percent as many riders in December of 2024 as the same month in 2019, according to preliminary data released late last week by the Federal Transit Administration. That’s down from 78.4 percent in November. Ridership for calendar year 2024 ended up being 76.5 percent of 2019.

Highway data will be added as soon as it is available. For a discussion of Amtrak and airline data, see this post from last week.

Because monthly numbers are preliminary and FTA updates prior months with each new release, I went through and corrected transit numbers for previous months in the above chart. I counted only 96.55 percent of February 2024 riders as that month had one more day than February 2019. As corrected, transit reached a peak, relative to pre-pandemic levels, of 78.7 percent in October, and dropped in both November and December. Continue reading

November 2024 Transportation Recovery

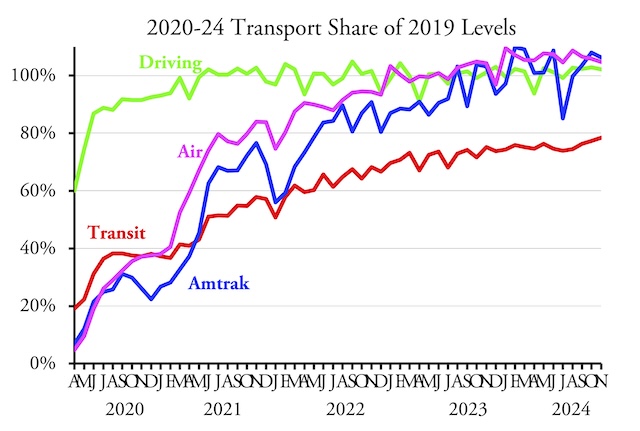
Americans drove 2.2 percent more miles, flew 4.7 percent more trips, and took Amtrak 6.2 percent more passenger-miles in November 2024 than the same month before the pandemic, according to data recently released by federal agencies. Transit ridership, however, still lagged almost 22 percent behind pre-pandemic numbers.

For once, the Federal Highway Administration, Federal Transit Administration, and Amtrak all released their monthly data reports at about the same time, late last week. TSA passenger counts are available only a day or two after each day, but I generally wait for data from other agencies before posting the airline data. Continue reading

Transit Executives Rake in the Dough

The news from California this week is that Michael Hursh, the CEO of the Alameda-Contra Costa Transit District (AC Transit), is resigning, but the agency will continue to pay him through September as a “senior advisor.” The real news is how much he was paid: according to Transparent California, in 2022 he collected $556,045.

Former AC Transit CEO Michael Hursh and current AC Transit board member Sarah Syed. Photos by AC Transit.

Transit agencies have historically paid their executives well, but $556,000 seems like a lot even for these agencies. So I decided to do a quick survey of transit agency executive pay. First, Hursh’s resignation is worth examining in a little more detail. Continue reading

Transit Carries 77% of Pre-Covid Riders in October

The nation’s public transit systems carried 77.3 percent as many riders in October 2024 as in the same month of 2019, according to data released yesterday by the Federal Transit Administration. This is the highest level transit has achieved since the beginning of the pandemic.

The increase is likely due to more people returning to downtown jobs instead of working remotely. While President Biden seems content to let many federal employees work at home, Elon Musk and Vivek Ramaswamy want to order them to return to work, which will create an interesting situation as the new administration takes office in January. Musk and Ramaswamy have hinted that their real goal is to get many federal employees to quit, thus relieving the president of the necessity of firing them to achieve the goal of reducing the federal budget by $2 trillion. Continue reading

SF Muni Tries Washington Monument Strategy

Like many transit agencies, San Francisco Municipal Transportation Agency (Muni) is facing a big budget deficit, and its response is to employ the Washington Monument Strategy. For those who don’t know, back in 1969 President Nixon tried to reduce the National Park Service’s budget and the Park Service responded by shutting down the Washington Monument. Tourists who wanted to ride the elevator to the top of the monument were directed to the senate and house office buildings and told to ask their elected representatives to restore the agency’s budget. Congress restored the funding, but Nixon fired the Park Service director who thought up the strategy a few years later.

Photo by Pi.1415926535.

We may need to rename this the Cable Car Strategy, as Muni is proposing to reduce its deficit by suspending service on the cable car routes as well as some streetcar routes that are mainly used by tourists. While it’s true that cable car ridership has been slow to recover from the pandemic — as of September, it was less than 69 percent of 2019 numbers — it’s also true that cable cars are the symbol of the city and an important tourist attraction. Considering all the bad publicity San Francisco has received lately, its commercial interests don’t want to do anything to depress tourism still further. Continue reading

September Transit Ridership 76.3% of 2019

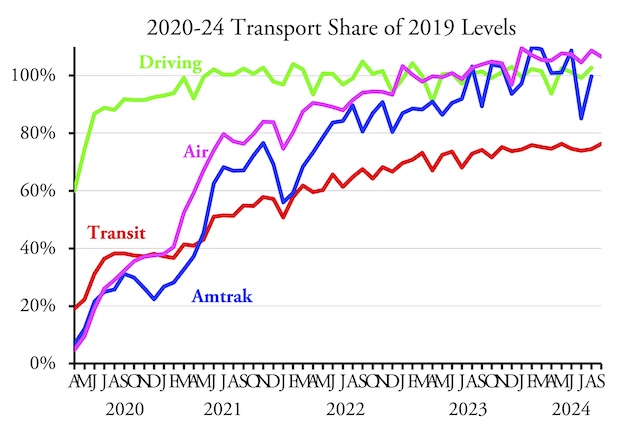
Transit agencies carried 76.3 percent as many riders in September of 2024 as they did in the same month in 2019, according to data released yesterday by the Federal Transit Administration. This is transit’s best performance, when measured as a share of pre-pandemic numbers, since the pandemic began.

Highway and Amtrak results for September will be posted here when it becomes available.

Highway travel had fully recovered from the pandemic by around July 2021. Air travel, which the Transportation Security Administration says carried 108.7 percent as many travelers as in September 2019, had recovered by January 2023 and Amtrak by October 2023. In October 2023, transit ridership still hadn’t reached 75 percent of pre-pandemic numbers, but that is probably the best it was going to do. Some of the growth in transit since then is due to some people returning to downtown offices, but much of that growth is probably more attributable to regular growth, not to recovery from the pandemic. Continue reading

Lower Fares, Higher Operating Costs

Transit agencies carried 18 percent more riders in 2023 than 2022, but 29 percent fewer than in 2019. Average trip lengths declined from 5.5 miles in 2019 to 5.0 miles in 2023, probably because commuter rail and commuter buses, which tend to carry riders the longest distances, did particularly poorly. Overall transit carried 35 percent fewer passenger-miles in 2023 than in 2019. These data are based on the National Transit Database and in particular the 2023 database that the Federal Transit Administration released last week.

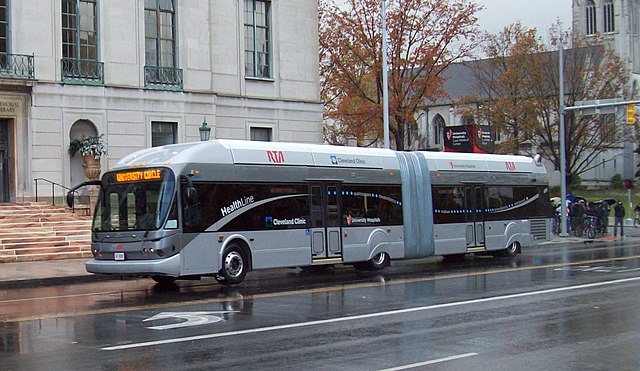
A bus-rapid transit line has generated lots of positive publicity for Cleveland transit, but the truth is that Cleveland has one of the worst-performing transit systems in the country, with ridership falling 35 percent between 2014 and 2019 and another 30 percent between 2019 and 2023. Photo by GoddardRocket.

Fares were proportional to passenger-miles being 35 percent less than in 2019, while operating costs were 22 percent greater. The result was that the operating subsidy per rider, at $7.26, was more than twice 2019’s, which was $3.51 and only a slight improvement over 2022’s operating subsidy of $7.59 per rider. Operating subsidies per passenger-mile grew from 64¢ in 2019 to $1.51 in 2022, declining only slightly to $1.45 in 2023. Continue reading

August Transit Ridership 74.5% of 2019

America’s transit systems carried 25.5 percent fewer riders in August of 2024 as in the same month of 2019, according to data released by the Federal Transit Administration last Friday. Transit ridership has hovered around 75 percent of pre-pandemic levels since November 2023.

I previously reported that July transit ridership was only 71.1 percent of 2019, but warned that several major transit agencies had not yet submitted July numbers. Those agencies, I estimated, made up about 2.5 percent of U.S. transit ridership so I guessed that the real number would be 73.6 percent. I was off by a bit: all major agencies have report July numbers and July ridership was 73.9 percent of 2019. Continue reading

July Transit Ridership 71.1% of 2019

I’m back from Japan and mostly recovered from jet lag. I may write about my Japan experiences next week but first it’s time to look closely at the July transit data posted by the Federal Transit Administration the day I left the states.

Based on a quickie analysis on my iPhone I previously reported that transit carried only about 64 percent as many riders in July of 2024 as the same month of 2019. However, I warned that I wasn’t certain about this as I was having trouble analyzing a 15 megabyte spreadsheet on the phone. In fact, the number is 71.1 percent, which is better than 64 percent but worse than any month since July 2023. Continue reading