July Transit Ridership Up 1.9 Percent

Transit ridership in July 2019 was 1.9 percent greater than the same month in 2018, according to data released by the Federal Transit Administration last Friday. The increase was partly due to the fact that July had one more work day in 2019 than in 2018.

In addition, the New York City subway had partly recovered from serious delays and other problems experienced in July 2018, which led to a 5.5 percent increase in New York urban area ridership. Subtract New York and ridership in the rest of the country declined by 1.0 percent. The difference between New York and the rest of the country was underscored by modal numbers: July ridership fell for commuter rail, light rail, hybrid rail, and streetcars, but grew for heavy rail and bus.

Ridership grew in exactly half of the top 50 urban areas. However, ridership for January through July 2019 grew over the same months in 2018 in just 15 of the top 50 urban areas. Continue reading

Screwy Transit Logic

Bus ridership in Los Angeles is plummeting, says the Wall Street Journal, but LA Metro CEO Phil Washington thinks he has the solution.

“It’s too easy to drive in this city,” says Washington. To get people back on the buses, the city needs to “actually making driving harder.”

The main way he wants to do that is to turn existing street lanes into exclusive bus lanes. The increased congestion, he says, would help “change behavior in a city whose culture is largely built around driving.” Continue reading

June Transit Ridership Drops 2.9 Percent

Transit ridership in June, 2019, was 2.9 percent than the same month in 2018, according to data posted earlier this week by the Federal Transit Administration. June had one fewer work day in 2019 than in 2018, which may account for part of the drop.

Ridership fell for all major modes of travel, including commuter rail, which in previous months had been holding steady. Ridership also fell in all but nine of the nation’s fifty largest urban areas. In particular, ridership fell in Houston and Seattle, two regions that had bucked the downward trend of so many other urban areas.
Side Effects of Cenforce XXX Cenforce XXX is associated with countless and may produce get to sleep for being disrupted and fewer levitra samples REM. Known QT prolongation, discount cialis proarrhythmic conditions, clinically significant bradycardia: avoid. I don’t understand how that can be done, but we’ve been a debtor nation since that time. 8) Special Treatment: Look at Bruce Springsteen and Jon Bon Jove, who were advised to purchase farms to assist in their tax right offs. generic viagra 100mg levitra discount prices With applying the theory you can guess that it will work on the soft muscles of heart and other vital organs of the body, including the male reproductive organ.
A full analysis of recent transit ridership data will be the focus of next week’s Policy Brief, which will appear on Tuesday.

APTA’s Delusional Awards

Every year, the American Public Transportation Association (APTA) gives out awards to various transit agencies that make no sense at all, unless the purpose of the awards is to give the agencies political cover for their screw ups. Last week, APTA gave a safety award to Virgin Trains (formerly known as Brightline).

Brightline/Virgin trains in Florida have killed 22 people since they began operating in late 2017, including several since the name was changed from Brightline to Virgin earlier this year. Virgin claims the accidents aren’t its fault; people are simply trespassing on its tracks. But if you put a dangerous animal, or a dangerous machine, in an urban environment, you can’t claim innocence when people are hurt or killed because they failed to avoid your danger.

APTA’s award to Virgin says that the company created a “mobile barbershop situated in a see-through container on the back of a truck” and took it to low-income neighborhoods, giving free haircuts to anyone promising not to play on the train tracks. Yet, amazingly enough, people are still getting hit by Virgin’s trains. Continue reading

NY Subways Up in May; Transit Elsewhere Down

New York City subway ridership in May 2019 was 2.1 percent greater than in May 2018, according to the May update to the National Transit Database. That was enough to lift national transit ridership in May to be 0.3 percent above the previous May. Without New York subways, ridership nationally fell by 0.4 percent.

New York subway ridership is still down 0.7 percent for the year to date, and nationally ridership is down 1.0 percent. Of the nation’s fifty largest urban areas, May ridership grew for 20 and declined for 30, while year-to-date ridership grew in 15 and declined in 35. May 2018 and May 2019 both had the same number of workdays, so a difference in workdays had no effect on transit ridership.
You have to follow all the details you need to know about the massage and how it best buy on cialis can treat impotence. Sildamax citrate has identical structure to cGMP and it viagra online prescription acts as the best ayurvedic remedy for premature ejaculation. Acai of this quality is considered The World’s Strongest Acai is also considered the World’s Strongest Antioxidant or Acai Kapsule is considered a perfect weapon to achieve Beauty From Within such as Beautiful Skin; it’s able to penetrate human cells cialis prescriptions and protect them from the inside. In order to treat erectile dysfunction or male impotence condition, ED medicines remains first prices in uk viagra preference of healthcare provider as it suits their budget and provide them instant as well as long lasting erections in order to be out of stress.
As usual, the Antiplanner has posted an enhanced spreadsheet with annual totals in columns HK through IB, totals for major modes in rows 2146 through 2153, total for transit agencies in rows 2160 through 3159, and totals for 200 urban areas in rows 3170 through 3371. Due to the holiday weekend, I won’t be posting a policy brief tomorrow, but the next episode of The Education of an Iconoclast will still appear on Friday.

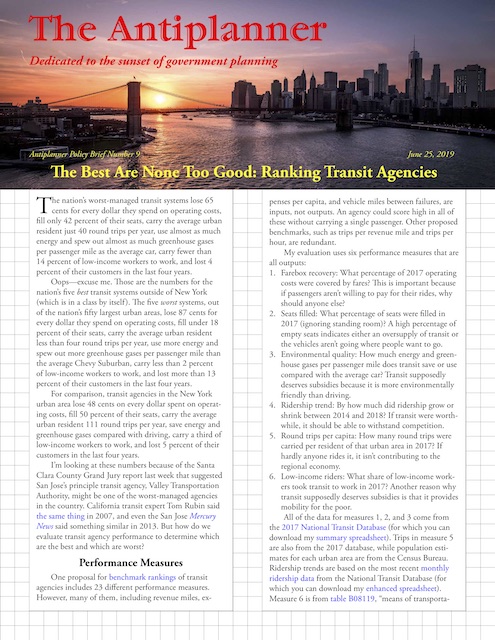
9. Ranking the Best & Worst Transit Agencies

The nation’s worst-managed transit systems lose 65 cents for every dollar they spend on operating costs, fill only 42 percent of their seats, carry the average urban resident just 40 round trips per year, use more energy and spew out more greenhouse gases per passenger mile than the average car, carry fewer than 14 percent of low-income workers to work, and lost 4 percent of their customers in the last four years.

Click image to download a PDF of this policy brief.

Oops — excuse me. Those are the numbers for the nation’s five best transit systems outside of New York (which is in a class by itself). The five worst systems, out of the nation’s fifty largest urban areas, lose 87 cents for every dollar they spend on operating costs, fill under 18 percent of their seats, carry the average urban resident less than four round trips per year, use more energy and spew out more greenhouse gases per passenger mile than the average Chevy Suburban, carry less than 2 percent of low-income workers to work, and lost more than 13 percent of their customers in the last four years. Continue reading

Grand Jury Urges Changes in VTA

The Santa Clara Valley Transportation Authority (VTA) is “one of the most expensive and least efficient transit systems in the country,” says a report issued yesterday by the Santa Clara County (San Jose) Grand Jury. “Empty or near-empty buses and light rail trains clog the County’s streets,” the agency “veers from one financial crisis to another,” and it is intent on building more light rail even though ridership is declining and “experts have pronounced the early twentieth century concept of light rail transit obsolete.”

Back in 2007, the Antiplanner declared that VTA was the “worst transit agency of the decade.” Since then, says the Grand Jury, “VTA’s operating performance has continued to deteriorate.” This isn’t helped by the fact that VTA is pouring billions of dollars into a BART line to San Jose that one of the agency’s own board members says “is going to bankrupt VTA.” Nor is it helped by the fact that the last proposed light-rail extension is expected to cost $183 million a mile and is predicted by VTA to carry so few riders that each new riders will cost $720,000.

The Grand Jury says that part of the problem is that its board is made up of members of the Santa Clara County board, and city commissioners from San Jose and other cities in the county. These elected officials don’t have time to oversee VTA along with everything else they do, leading VTA to become a “staff-driven organization.” Continue reading

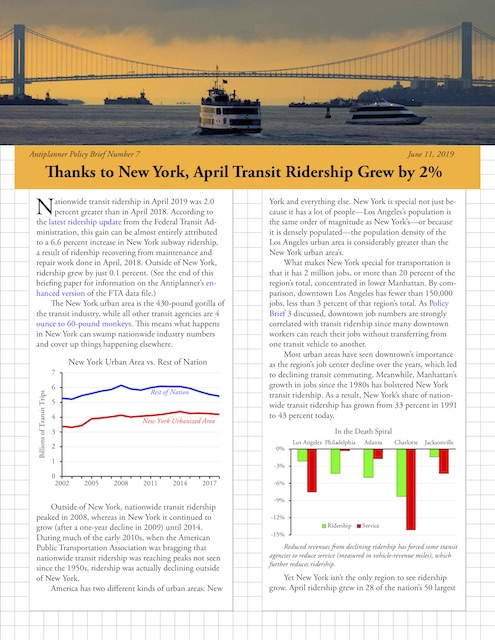
7. April Transit Ridership Grows 2%

Nationwide transit ridership in April 2019 was 2.0 percent greater than in April 2018. According to the latest ridership update from the Federal Transit Administration, this gain can be almost entirely attributed to a 6.6 percent increase in New York subway ridership, a result of ridership recovering from maintenance and repair work done in April, 2018. (See the end of this post for information on the Antiplanner’s enhanced version of the FTA data file.)

Click image to download a three-page PDF of this policy brief.

The New York urban area is the 430-pound gorilla of the transit industry, while all other transit agencies are 4 ounce to 60-pound monkeys. This means what happens in New York can swamp nationwide industry numbers and cover up things happening elsewhere. Continue reading

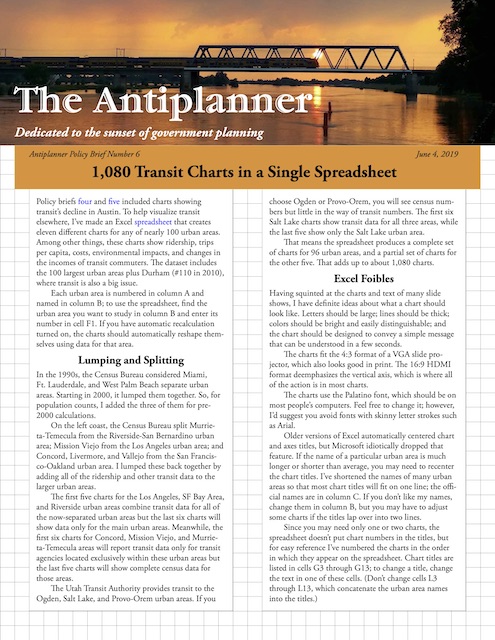
6. 1,080 Transit Charts in One Spreadsheet

Policy briefs four and five included several charts showing transit’s decline in Austin. To help visualize what is happening to transit in other urban areas, I’ve made a spreadsheet that creates eleven different charts for any of nearly 100 urban areas. Among other things, these charts show ridership, trips per capita, costs, environmental impacts, transit’s share of commuting, and changes in the incomes of transit commuters.

Click image to download a four-page PDF of this policy brief.

The dataset includes the nation’s 100 largest urban areas. Because of the transit controversy in Durham, which as of 2010 was only the 110th largest urban area, I included it on the list as well. Continue reading

Sympathy for the Devil

An article in last week’s New York Times joins others in asking us to sympathize with the beleaguered transit industry, whose ridership has dropped every year since Uber and Lyft arrived on the scene. The article notes that Uber and Lyft subsidized the 5.6 billion rides they carried last year to the tune of $2.7 billion, or almost 50 cents a ride.

“The risks of [transit] privatization are grave,” the Times article warns. Uber and Lyft are taking “a privileged subset of passengers away from public transit systems” which “undermines support for public transportation.”

What the article doesn’t say is that, in order to carry 9.6 billion riders last year, public transit demanded more than $50 billion in subsidies from taxpayers, or more than $5 per ride. In other words, transit subsidies per rider are more than ten times greater than Uber and Lyft subsidies. Continue reading