
The owner of San Francisco’s first and fourth largest hotels announced Monday that it is going to walk away from the mortgage it owes for those buildings. The owners of the Hilton Union Square Hotel noted that San Francisco’s path to recovery remains clouded and elongated by major challenges,” including the fact that fewer groups want to hold conventions in a city now more famous for its homeless population than its cable cars and restaurants.
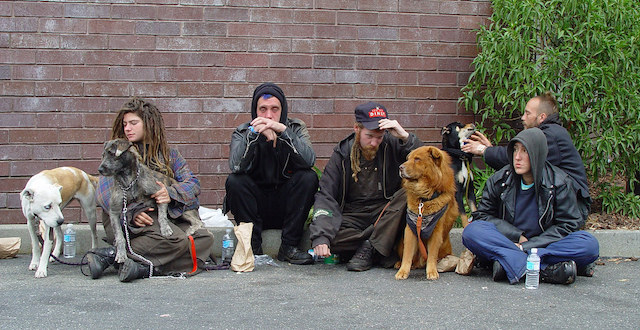
Once famous as the center of the 1960s counterculture, Haight Street is now the home of a new kind of counterculture. Photo by Franco Folini.
Last month, Nordstrom said that it was closing both its stores in downtown San Francisco. “The dynamics of the downtown San Francisco market have changed dramatically over the past several years,” said a Nordstrom official, “impacting customer foot traffic to our stores and our ability to operate successfully.” Continue reading


