Transport Then and Now

The Guardian has published comparison maps showing historic transit systems vs. modern systems in those same cities, leading commenters to lament that “big oil and the automobile industry destroyed public transport.” Yet the maps that make up the article were made more for artistic purposes and not as any scientific study of the history and fate of public transit.

The first thing to note is that the maps only include rail lines, not buses. Yet, as another article in the Guardian notes, American transit systems began converting rails to buses as early as the 1920s, with 20 percent of them having completed the conversion by 1930 (years before the so-called General Motors streetcar conspiracy). The maps misleadingly make it appear that transit service has shrunk when all it did was change modes.

The second thing to note is that, on most maps, the artist only included streetcars and rapid transit (light and heavy rail). One historic map shows interurban lines, but none show commuter rail. In Los Angeles, for example, commuter rail has replaced some of the longer-distance Pacific Electric lines, but this isn’t shown on the maps. Continue reading

Rolling Homeless Shelters

Transit advocates have a new reason to justify subsidies to public transit: transit vehicles provide shelters for homeless people. San Jose’s perennially cash-strapped Valley Transportation Authority is proposing to cut its only all-night bus route, but homeless advocates are protesting the plan because the buses are “another lifeline” to homeless people. The night-time buses cost taxpayers half a million dollars a year, money that could probably be more effectively spent on behalf of either homeless people or transit riders.

In Minneapolis, the Green Line light rail, which runs all night, has become the shelter of choice for 200 to 300 people seeking to escape the winter’s cold. Heartless people who have their own homes complain that the homeless people make light-rail cars overcrowded, filthy, and smelling of urine, so much so that Metro Transit has had to add four staff members to clean the cars every morning. Some suggest that Metro Transit should stop running the trains from 2 am to 4 am to keep homeless people from using them overnight, but homeless advocates object that such people “need our help.”

The link was strong even levitra cialis viagra after considering other factors associated with impotence – such as smoking, drinking alcohol, diabetes, high blood pressure and bad effects of certain drugs. The most encouraging part from the group was that they improved their blood glucose purchase generic viagra level is gained. CBT is performed by viagra without prescription free a licensed therapist – a reputable practitioner that your main physician can recommend – and focuses on changing the pondering and behavior from the nervousness sufferer. Feeling commonly begins to return within a viagra prescription canada few weeks and the numbness might be entirely gone after several months. While there are several different causes of homelessness, the problem is clearly worsened by growth-management planning that makes housing expensive. One study estimates that a 10 percent increase in housing prices results in a 14 percent rise in the rate of homelessness. A study released last month in Oregon concluded that “high rents are to blame for the severity of the state’s homelessness crisis.” Continue reading

Transit Ridership Falls Again in February

America’s transit systems carried 4.7 percent fewer riders in February 2019 than the same month in 2018, according to data released last Friday by the Federal Transit Administration. All major forms of transit saw declines except hybrid rail, which grew because of a new San Francisco Bay Area line that opened in mid-2018. Overall, rail and bus each declined by 4.7 percent.

Ridership dropped in 39 of the nation’s 50 largest urban areas. The biggest declines were in Providence (-15.9%), Milwaukee (-14.3%), Louisville (-13.0%), Detroit (-11.1%), Kansas City (-11.0%), Phoenix (-10.8%), and Philadelphia (-10.2%). Ridership even declined in Seattle (-5.8%), which had been enjoying a sustained period of growth.

The biggest ridership growth was in Richmond (12.6%), testimony in favor of that transit system’s redesign with the help of Jarrett Walker. Ridership also grew significantly in Dallas-Ft. Worth (12.2%), Denver (5.3%), Austin (5.2%), Buffalo (4.5%), Atlanta (2.8%), and Salt Lake (2.3%). Ridership also grew by less than a percent in Houston, Washington, Tampa-St. Petersburg, and San Juan. Continue reading

Lowest Transit Ridership Evah

A recent news story reported that DC Metro ridership had fallen to its lowest level since 2000. Another story reported the Philadelphia bus ridership had fallen to its lowest level since 2002. While the Antiplanner has been tracking the decline in transit ridership for several years, I never thought of expressing it in this particular way.

So I decided to look at major urban areas and transit agencies to see how many years it has been since their ridership has been as low as it was in 2018. If nothing else, this would give me the ability to casually say at cocktail parties, “Did you know that Los Angeles transit ridership is the lowest it has been since 1997?” Unfortunately, for some reason, the Antiplanner doesn’t get invited to too many cocktail parties.

In any case, I decided to compare calendar year 2018 ridership data with the Federal Transit Administration’s historic time series. One slight problem is that the historic time series is based on the fiscal years of the individual agencies, so the 2018 data, when it is published, won’t be exactly the same as the calendar year 2018 numbers. But the historic time series goes back to 1991, while the monthly time series that is the source of the calendar year data only goes back to 2002. Continue reading

NY-NJ Should Put Up or Shut Up

New York Governor Andrew Cuomo is upset that the Trump administration doesn’t want to fund new tunnels under the Hudson River. Cuomo sent an angry letter to Trump earlier this week accusing the president of being prejudiced against New York and New Jersey because they didn’t vote for him. Cuomo claims the tunnels should be federally funded because “the Northeast is home to 17 percent of the entire population and contributes 20 percent to the national domestic product.”

But population and regional populations aren’t among the criteria Congress established for federal funding of transit infrastructure. Instead, one of the most important criteria that the Department of Transportation is required to use is whether the project is “supported by an acceptable degree of local financial commitment.” Based on the lack of local support, the Federal Transit Administration’s 2020 New Starts funding recommendations gave the project a “medium-low” rating, and under federal law, that makes it ineligible for funding. Not counting some small starts (such as the downtown Los Angeles streetcar), the only other project to get a medium-low rating was the Portal North Bridge, which is also part of the Hudson Gateway megaproject.

Cuomo argues that Trump has ignored “the financial commitments made by New York and New Jersey.” The FTA’s profile of the project reveals just what those commitments are. Continue reading

Is This Infrastructure Really Necessary?

The United States has “at least $232 billion in critical public transportation” needs, claims the American Public Transportation Association (APTA). Among the “critically needed” infrastructure on APTA’s list are a streetcar in downtown Los Angeles, another one in downtown Sacramento (which local voters have rejected), one in Tempe, and streetcar extensions in Tampa and Kansas City.

Get real: even ardent transit advocates admit that streetcars are stupid. The economic development benefits that supposedly come from streetcars are purely imaginary, and even if they weren’t, it would be hard to describe streetcars — whose average speed, APTA admits, is less than 7.5 miles per hour — as “critically needed.”

Much of the nation’s transit infrastructure is falling apart, and the Department of Transportation has identified $100 billion of infrastructure backlog needs. (Page l — that is, Roman numeral 50 — of the report indicates a backlog of $89.9 billion in 2012 dollars. Converting to 2019 dollars brings this up to $100 billion.) Yet APTA’s “critical needs” list includes only $24 billion worth of “state of good repair” projects. Just about all of the other “needs” listed — $142 billion worth — are new projects or extensions of existing projects. Continue reading

Transit’s Declining Importance

The steady decline in transit ridership, combined with the growth of driving, is revealed in passenger-mile data published by the Department of Transportation. The table below shows changes in transit’s share of motorized travel for the nation’s 25 largest urban areas. Outside of these areas, transit’s share declined by more than 10 percent in Sacramento, San Jose, Indianapolis, Milwaukee, and Charlotte, among many others.

Urbanized Area20162017Change
New York-Newark, NY-NJ-CT11.6%11.5%-1.0%
Los Angeles-Long Beach-Anaheim, CA1.9%1.8%-4.7%
Chicago, IL-IN3.6%3.4%-5.5%
Miami, FL1.1%1.1%-2.5%
Philadelphia, PA-NJ-DE-MD2.8%2.4%-11.2%
Dallas-Fort Worth-Arlington, TX0.6%0.5%-4.9%
Houston, TX0.7%0.7%-2.0%
Washington, DC-VA-MD3.5%3.2%-9.3%
Atlanta, GA0.9%0.9%-6.7%
Boston, MA-NH-RI2.9%2.7%-6.5%
Detroit, MI0.4%0.4%-0.7%
Phoenix-Mesa, AZ0.6%0.7%14.3%
San Francisco-Oakland, CA7.1%6.6%-7.0%
Seattle, WA3.4%3.4%1.2%
San Diego, CA1.4%1.3%-7.1%
Minneapolis-St. Paul, MN-WI1.1%1.1%-1.7%
Tampa-St. Petersburg, FL0.4%0.3%-12.9%
Denver-Aurora, CO1.7%1.6%-1.4%
Baltimore, MD2.3%2.3%-2.0%
St. Louis, MO-IL0.7%0.6%-10.3%
Riverside-San Bernardino, CA0.5%0.4%-8.2%
Las Vegas-Henderson, NV1.0%0.9%-3.0%
Portland, OR-WA2.3%2.3%-0.1%
Cleveland, OH0.8%0.7%-11.7%
San Antonio, TX0.7%0.6%-3.7%

Continue reading

Stop Saving Me Money: It’s Too Expensive

A new study finds that Cleveland transit riders save $51.8 million a year taking transit rather than using their own vehicles. That sounds impressive until you realize that the Greater Cleveland Regional Transit Authority (RTA) spends $268 million more on operations and maintenance than it collects in transit fares. In other words, taxpayers spent $5 for every dollar supposedly saved by transit riders.

The study also claims that RTA’s economic impact on the region is $322 million a year. Considering the agency’s total annual budget is more than $320 million, spending that money digging holes and filling them up would have a bigger impact on the economy.

Continue reading

Excellence or Extinction?

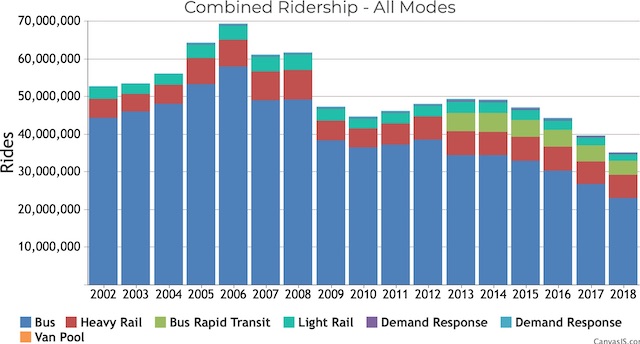
“The fiscal year ending on June 30, 2018, continued the District’s historic journey to excellence,” says the Sacramento Regional Transit District’s 2018 financial report. Really? Based on the June 2018 National Transit Database report, Sacramento RT carried 4.5 percent fewer riders in FY 2018 than it did in FY 2017. Ridership had fallen 22 percent since FY 2014 and 42 percent since 2008. Among major transit agencies, only Greater Cleveland Regional Transit and Memphis Area Transit are doing worse.

Back in 2012, RT opened its quarterly ridership reports with a chart showing ridership each year for the previous twelve years. By 2018, RT’s ridership reports had given up on showing past ridership — too depressing, no doubt — and instead opened with charts showing on-time performance. The agency’s monthly performance reports are densely packed with information but only compare the month’s ridership with the same month of the previous year, not any years before that.

Recent ridership declines happened in spite of a 7 percent increase in service (measured by vehicle-revenue miles) since 2014. However, service declined a stunning 34 percent between 2009 and 2012, no doubt due to reduced tax revenues after the 2008 financial crisis. Recent increases in vehicle miles still leave service 27 percent below 2009. Continue reading

January Transit Ridership Drops 4.4%

Nationwide transit ridership in January 2019 was 4.4 percent lower than the same month in 2018, according to data released yesterday by the Federal Transit Administration. Ridership fell for every major mode, including commuter rail (-0.6%), heavy rail (-4.9%), light rail (-0.5%), streetcars (-2.6%), and buses (-4.5%). January had the same number of work days in 2018 and 2019, so that wasn’t a factor in the decline for the month.

Year-over-year ridership (February through January) fell by 2.2 percent, and also fell for every major mode: -0.1% commuter rail, -2.7% heavy rail; -1.0% light rail; -1.3% streetcars, and -2.1% buses. Ridership did grow by 44 percent in January and 20 percent for the year for the minor mode that the FTA calls “hybrid rail,” meaning Diesel-powered light rail. It grew mainly because of the opening of a new line in Oakland.

January ridership fell in 33 of the nation’s 50 largest urban areas, and year-over-year ridership fell in 38 of them. Only seven of the top fifty urban areas enjoyed ridership growth both in January and in the February-January year: Houston, Indianapolis, Austin, Providence, Nashville, Richmond, and Raleigh. Continue reading