Good News for the Transit Industry

“The public transportation market is forecasted to grow by $90.07 bn during 2022-2027,” says a new report from someone called Infiniti Research. That represents an annual growth rate of 5.84 percent per year.

For a mere $2,500 ($4,000 for the “enterprise” version), you can read this fairy tale about how the transit market is going to grow once we install multi-billion-dollar hyperloops in every city.

“The development of hyperloop transportation systems [is] one of the prime reasons driving the public transportation market growth during the next few years,” claims the report, putting it in the world of pure fantasy land. Actually, 5.84 percent annual growth seems pretty modest considering how diminished the transit industry is today: at that rate, it would take 8 years to fully recover to pre-pandemic levels. At the same time, unless most employers force employees to stop working at home, even 5.84 percent seems unlikely. Continue reading

U.S. Per Capita Travel Was 18,000 Miles in 2021

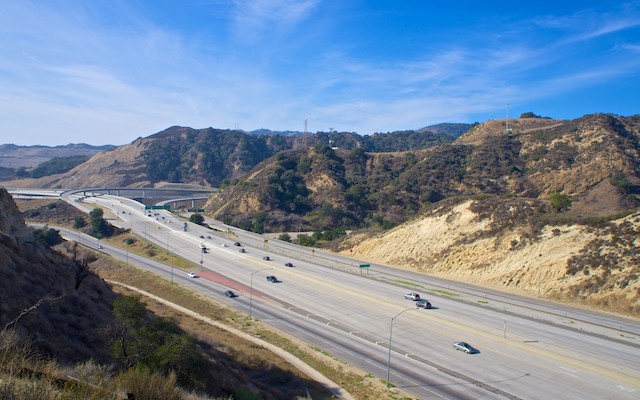
Per capita travel in the United States was a little lower in 2021 than 2019, according to data recently released by the Bureau of Transportation Statistics (BTS). In 2021, the average American traveled 17,909 miles by air, auto, transit, and Amtrak, down 8 percent from 19,475 miles in 2019.

Photo by Ken Kistler.

To calculate that number, however, I had to correct an error in the recently released spreadsheet, which says that domestic airlines carried 172.8 billion passenger-miles in 2021, just 23 percent of the 754.5 billion miles they carried in 2019. This is an obvious typo, as another BTS table says that domestic airline flights carried 571.8 billion passenger-miles. (To view passenger-miles on that web site, click on “Revenue Passenger-Miles” at the top of the table.) Continue reading

Why Save Obsolete Transportation?

David Zipper, who has a master’s degree in urban planning, writes on Vox about how transit agencies need to save themselves from a fiscal cliff. To do so, he says, they must “secure new and reliable revenue streams from state and regional sources.” To convince skeptical members of the public they need to provide those revenue streams out of their taxes, agencies need to “demonstrate an ability to replace car trips, not just serve economically disadvantaged people,” because only by replacing car trips can they prove they are “curtailing congestion, reducing auto emissions, and boosting economic growth.”

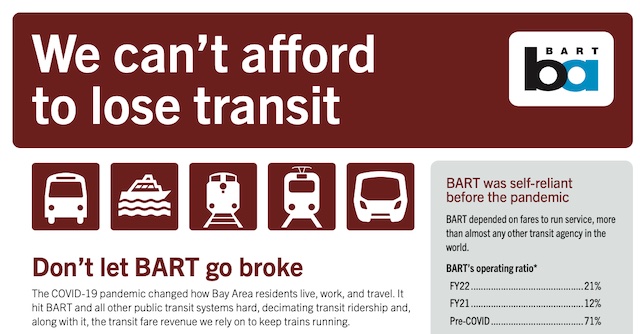
BART’s plea for more subsidies falsely claims that “BART was self-sufficient before the pandemic” when its own data show that fares covered only 71 percent of operating costs and zero percent of capital costs.

Yet Zipper never really says why we need to save transit. He claims that transit has been “indispensable” for major metros, but what he really means is that it is indispensable for major downtowns such as Chicago, Philadelphia, and San Francisco. In reality, the only metro area for which transit is truly indispensable is New York, and if it is so indispensable there, then New Yorkers should be the ones to pay for it. Continue reading

Population Falls in 18 States

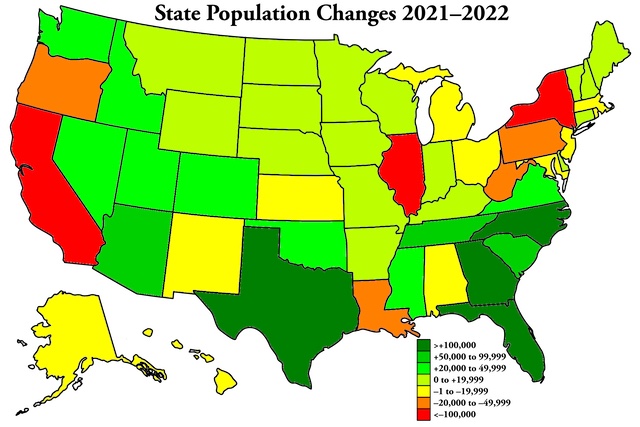
Between 2021 and 2022, the populations of California, Illinois, and New York all declined by more than 100,000 people, according to estimates released yesterday by the Census Bureau. Louisiana, Oregon, Pennsylvania, and West Virginia all lost more than 10,000 residents, while 11 other states also declined in population.

Red, orange, and yellow states lost population, while green states gained. No state lost between 50,000 and 99,999, so there is no color for that group. Click image for a larger view.

The nation as a whole grew by 1.26 million, but clearly that gain was not evenly distributed. Instead, Texas grew by 470,000 residents, Florida by 416,000, North Carolina by 133,000, Georgia by 125,000, Arizona by 94,000, South Carolina by 89,000, and Tennessee by 83,000 (all these numbers are rounded to the nearest 1,000). Percentagewise, the fastest growing states were Florida (1.9%), Idaho (1.8%), South Carolina (1.7%), Texas (1.6%), South Dakota, and Montana (1.5% each). Arizona, Delaware, Georgia, North Carolina, Tennessee, and Utah all grew by more than 1 percent. The biggest losers were New York (-0.9%) Illinois (-0.8%), Louisiana (-0.8%), West Virginia (-0.6%), Hawaii (-0.5%), and Oregon (-0.4%). Continue reading

Housing Doesn’t Need Government Planning

“Housing needs planning” is the opening line of Colorado Senate Bill 23-213, which was introduced into the legislature last week. By “planning” the bill means government planning, and the proposed law would require the state to determine housing needs and set housing targets and to interfere with local zoning to require more accessory dwelling units, multifamily housing, and transit-oriented developments.

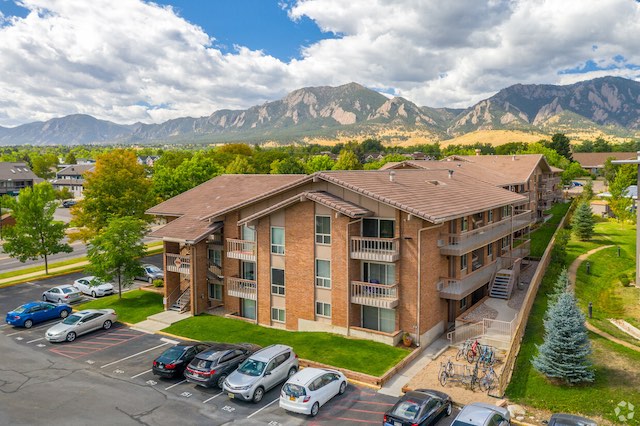
Apartments in Boulder, Colorado, the most heavily planned and most expensive housing market in the state.

The basic premise of this law is wrong: housing and government planning go together like oil and water. A look at housing markets in Colorado and nationwide show that states and regions with more planning end up having less affordable housing. A secondary premise, that multifamily housing is more affordable than single-family homes, is also wrong. Continue reading

Tax Netflix to Fund Transit?

New York’s Metropolitan Transportation Authority will soon go off a fiscal cliff, partly due to reduced ridership but also due to bad management. But never fear: New York legislators have a solution. They propose to tax Netflix and Uber to raise money to keep the subways and buses running.

One of the most expensive transit projects in the world, the Second Avenue Subway is expensive partly because the MTA spent more on consultants than it did on actual construction. MTA Capital Construction photo by Rehema Trimiew.

Taxing Uber makes kind of a warped sense, like taxing jet airliners in order to subsidize Conestoga wagons. But taxing Netflix? Just what does Netflix have to do with urban transit? Next thing you know, someone will propose taxing people for working at home because, you know, homes are “stealing” riders away from transit. Continue reading

Transit Agencies Go Insane

Earlier this month, the Federal Transit Administration published its annual report on funding recommendations for transit capital improvement grants. Each year, I review the accompanying list of projects being planned or under construction to see how much construction costs have grown since the previous year. This year, however, transit agencies seem to have learned a lesson from the pandemic and have curtailed their wild spending on pointless projects.

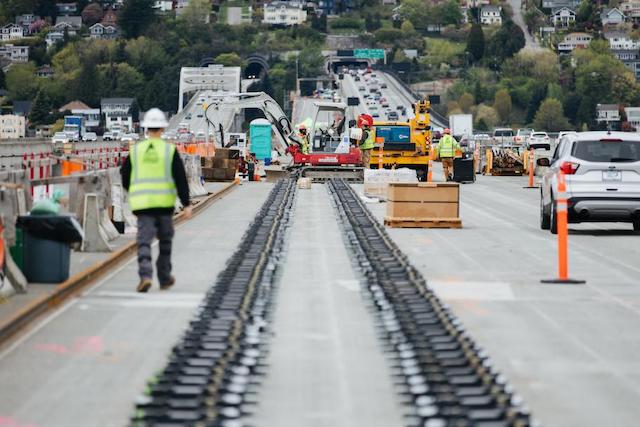
Sound Transit is building light rail on what was once freeway lanes across Lake Washington. Photo by Sound Transit.

Just kidding. In fact, they are spending more than ever. In the 1990s, light-rail lines that cost $50 million a mile ($100 million in today’s dollars) were considered extravagantly expensive. A decade ago, the average light-rail line cost about $125 million a mile ($160 million in today’s dollars). Last year, average light-rail construction costs had risen to $278 million a mile (about $310 million today). Continue reading

The Latest International Affordability Data

“Housing affordability in 2022 continued to reflect the huge price increases that occurred during the pandemic demand shock,” reports demographer Wendell Cox in his 2023 international housing affordability report. “Some housing affordability improvements have since occurred and more are likely as the demand shock is hopefully replaced by more normal market trends.”

Click image to download a 3.6-MB PDF of this 26-page report.

Cox measures housing affordability in more than 90 urban areas located in Australia, Canada, Hong Kong, Ireland, New Zealand, Singapore, the United Kingdom, and the United States by dividing median home prices with median household incomes. I use the same measure except I use median family incomes, which are readily available through 2021 using U.S. census data. Cox probably uses household incomes because they are more readily available for 2022 and in other countries. This is the latest update of a series of reports going back to 2005 (with data for 2004). Continue reading

Promise Rapid Transit, Deliver Streetcars

On November 2020, in the midst of the pandemic, Austin voters foolishly agreed to raise property taxes in order to build 28 miles of light rail at a projected cost of $5.8 billion. To avoid congestion, the downtown portion of light-rail lines would go through a four-mile-long tunnel.

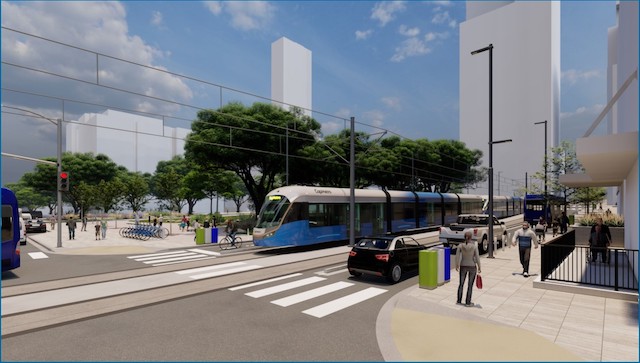
Artist’s impression of light rail running near downtown Austin.

No one reading this blog will be surprised to know that, in the short amount of time since then, projected costs have nearly doubled to $10.3 billion. Early this week, the city’s transit planners announced a new plan that would build fewer than half as many miles of light rail. Continue reading

January Driving 98.9% of 2019

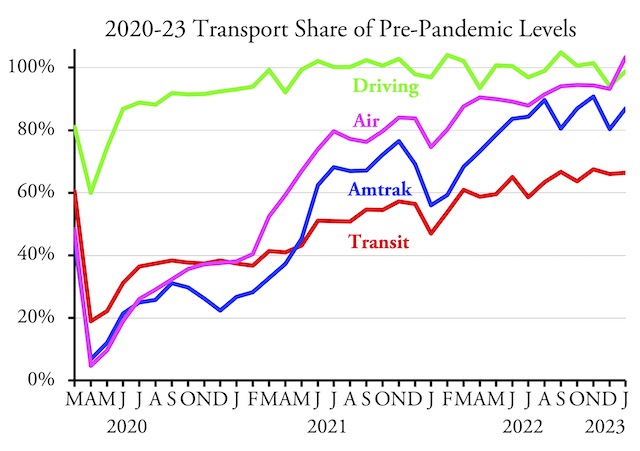
Americans drove 98.9 percent as many miles in January 2023 as they did in the same month of 2019, according to data released by the Federal Highway Administration yesterday. Driving in rural areas averaged 4.6 percent greater than in 2019, while driving in urban areas was about 3.4 percent less.

Amtrak numbers are from the company’s monthly performance report; see this post for a discussion of those numbers. Transit numbers are from the Federal Transit Administration and air travel numbers are from the Transportation Security Administration; see this post for a discussion of those numbers.

January’s urban driving exceeded 2019 miles in 20 states. The biggest gains were in Rhode Island (up 22%), Louisiana (10%), Idaho (8%), New Jersey (8%), Texas (7%), and Pennsylvania (5%). The biggest shortfalls in urban driving were in Michigan (down 16%), Colorado (-16%), Arkansas (-15%), North Dakota (-14%), and Hawaii (-13%). Continue reading