Search Results for: peak transit

2017 National Transit Database Released

Transit ridership dropped by 2.9 percent in 2017 despite a 0.7 percent increase in transit service (as measured in vehicle revenue miles). This isn’t big news to Antiplanner readers, but it’s a little more official with the release, earlier this week, of the 2017 National Transit Database. While we’ve previously looked at calendar year or July through June ridership numbers, the database uses the fiscal years of the individual transit agencies, which may range anywhere from July 2016 through June 2017 to January 2017 through December 2017, so the numbers won’t be exactly the same.

The full database also includes fares, costs, energy consumption, and other information not previously available for 2017. For example, transit used an average of 3,376 BTUs per passenger mile in 2017, a 2.3 percent increase from 2016. Greenhouse gas emissions per passenger mile also increased by about 1.0 percent. These increases, of course, are due to the increased vehicle miles combined with a 2.6 percent fall in passenger miles.

Transit’s 3,376 BTUs per passenger mile is just about tied with light trucks (pick ups, SUVs, full-sized vans), but well behind the average car. In 2015, cars used only about 3,030 BTUs per passenger mile and may have been even more energy efficient in 2017. Continue reading

Transit Is About Downtown

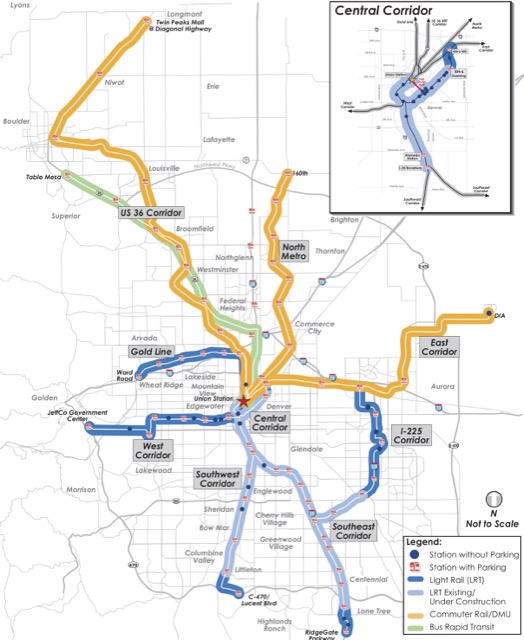
The Antiplanner’s faithful ally, Wendell Cox, likes to say that “transit is about downtown.” This is because most transit lines represent spokes focusing on a downtown hub, making it easy for people throughout an urban area to take transit downtown, but difficult for them to get from anywhere outside of downtown to somewhere else that is outside of downtown.

This can be seen in the above map of Denver’s 2004 rail transit plan known as FasTracks. All of the rail lines but one converge on downtown Denver, where about 20 percent of the 120,000 workers take transit to work. Even though downtown has less than 10 percent of the region’s jobs, 40 percent of all transit commuters in the region commute to downtown jobs. (All of these numbers are from Cox’s 2014 Central Business District report, which is based on 2006 data.) Continue reading

Transit Update

The Antiplanner has corrected a few very minor errors and added some new calculations to the June 2018 ridership spreadsheet. If you downloaded the spreadsheet I posted Wednesday, you probably should redownload it now.

The new calculations include fiscal year ridership totals for 2012 through 2016. Nationally, ridership peaked in 2014, and has declined in every fiscal year since then. Although the nationwide decline since 2014 was just 7.5 percent, declines in many urban areas were much larger: 29% in Memphis; 27% in Charlotte; 26% in Miami; 25% in Albuquerque; 24% in Cleveland; 22% in St. Louis; 21% in Milwaukee, Sacramento, and Virginia Beach; 20% in Los Angeles.

Transit began falling in some of these urban areas, such as Sacramento and Memphis, much earlier than 2014. With the additional fiscal year data, you can track this decline back to 2012. The calendar year data go back to 2002. Continue reading

Are the Koch Brothers Killing Transit?

Transit supporters have a new explanation for transit’s decline: the Koch brothers are killing new transit projects. At least, that’s what the New York Times says, and since that is the nation’s newspaper of record, it must be true.

According to the article published yesterday, Americans for Prosperity have combined with the Cato Institute to fight light rail all over the country. Since both of these groups were initially funded by the Koch brothers, it must be some sort of conspiracy.

Speaking for myself, I don’t mind being associated with the Koch brothers. After all, they support gay marriage, marijuana legalization, and ending Middle East military interventions. They oppose tax-increment financing, the use of eminent domain to take private property to give to other private developers, and NSA surveillance of American citizens. What’s not to love? Continue reading

The Future of San Antonio Transit

Someone asked the Antiplanner to briefly review the prospects for public transit in San Antonio. Much of my answer would apply to many other urban areas as well.

1. Transit Is About Downtown

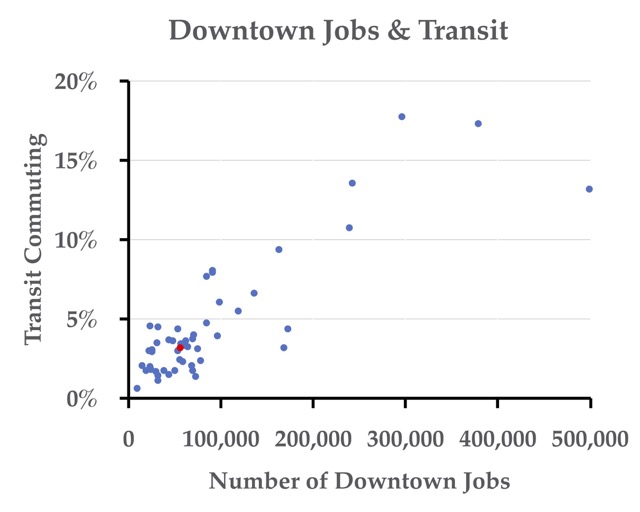
A century ago, most urban jobs were downtown and people walked or rode transit to those jobs from dense residential areas. Today, only about 7.5 percent of urban jobs are located downtown; in San Antonio it’s about 6.2 percent.

Source: Wendell Cox, United States Central Business Districts for downtown jobs; 2010 American Community Survey table B08301 for percent of transit commuters. Continue reading

Atlanta’s Transit Future

Mass transit is collapsing everywhere,” argues an op-ed in The Hlll. One such collapse is taking place in Atlanta, where ridership has fallen more than 20 percent since 2008.

In 1980, transit carried more than 9 percent of Atlanta-area commuters to work, and ridership peaked in 1985 at 155.7 million trips. Since then, the Metropolitan Atlanta Regional Transit Agency has added 28 miles of rail lines, more than doubling the length of its heavy-rail system. The region’s population has grown from less than 1.9 million to 5.0 million people, an increase of 166 percent.

So how many rides did transit carry in 2017? About 131.3 million, a 15 percent decline from 1985. Worse, transit trips per capita crashed from 82 in 1985 to just 26 in 2017, a 68 percent decline, while transit carried just 3.8 percent of commuters to work in 2016. Continue reading

March Transit Ridership Drops 5.9%

Some have blamed declining transit ridership on low gas prices, but gasoline was about 10 percent more expensive in March 2018 than March 2017, yet March transit ridership was 5.9 percent less than in the same month in 2017. To be fair, March had one fewer work day in 2018 than in 2017, which could account for some of the decline, but January had one more work day in 2018 than 2017, and ridership still declined.

The Federal Transit Administration released March ridership numbers over the weekend. As usual, the Antiplanner has supplemented the raw numbers with a spreadsheet that totals ridership by years (2002-2018) in columns GW through HM; by major modes in rows 2116 through 2122; by transit agency in rows 2131-3129; and by the 200 largest urbanized areas in rows 3131 through 3330.

Previous releases showed that transit has been declining in nearly all major urban areas except Seattle and, in some recent months, Houston. March’s numbers are even more dire, as ridership declined in all of the top 38 urbanized areas including Houston and Seattle. Of the top 50 urban areas, ridership grew only in Providence (by a mere 0.1 percent), Nashville (by a respectable 8.2 percent), Hartford (8.1 percent), and Raleigh (by 3.5 percent). Continue reading

Rejoice in Transit’s Decline (plus new book)

“Urban transit was developed for a kind of city that no longer exists,” says an op-ed in USA Today, “one in which most jobs were downtown and most residents lived near downtown.” For people who can’t or don’t want to drive, ride hailing makes much more sense than mass transit, so we should be happy to see transit (and the taxes we pay to subsidize it) decline.

The article also reveals the title of a new book that will be out this fall: Romance of the Rails: Why the Passenger Trains We Love Are Not the Transportation We Need. This book will provide the background needed to understand transit and intercity passenger trains today. Continue reading

Will Spending More Money Save Transit?

Speaking of simplistic solutions to complex problems, Streetsblog has an article on how to save transit. Based on ridership numbers from thirty-five urban ares, the pro-transit site says the two keys to transit success are, first, to spend lots of money, and second, to spend it in the right places.

I wonder why no one ever thought of that before.

The article points out that only three urban areas saw an increase in transit ridership from 2016 to 2017: Seattle, Phoenix, and Houston (where ridership grew just 0.1 percent). The numbers in the article are somewhat different from the numbers the Antiplanner calculated from the National Transit Database, but I agree that the only significant growth was in Seattle and Phoenix. (My numbers show a 0.1 percent decline in Houston.) Continue reading

2017: Transit’s Disastrous Year

Nationwide transit ridership in December 2017 was nearly 5 percent less than December 2016. Ridership for the calendar year was 2.6 percent less than in 2016 and 6.7 percent less than 2014, transit’s recent peak. These numbers are based on the latest National Transit Database spreadsheet posted by the Federal Transit Administration.

As usual, I’ve supplemented the FTA file by summing the years (2002 through 2017 in columns GU through HJ), transit agencies (rows 2101 through 3098), and the 200 largest urban areas (rows 3101 through 3300). The resulting spreadsheet is about 8 megabytes. While these numbers may be preliminary, they provide a pretty good indication of the health — or lack of it — of the transit industry.

The results show that 2017 ridership was lower than in 2016 in all but two of the fifty largest urban areas: Phoenix and Seattle. As of the posting of November data, it appeared that Houston would be a member of this tiny club, but Houston’s December ridership fell by 1.1 percent from December 2016, leading 2017 as a whole to be 0.1 percent less than 2016. While some of that decline may have been due to Hurricane Harvey, the December drop off does not bode well for 2018. Continue reading