Search Results for: rail

October Transit Ridership Levels Off

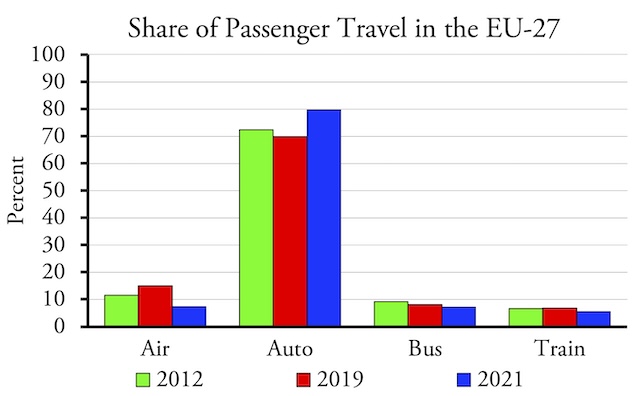
Transit carried 73.90 percent as many riders in October 2023 as in the same month in 2019, according to data released by the Federal Transit Administration yesterday. This is just a couple of hairs less than the 73.92 percent carried in September. Rail ridership was 71.0 percent of 2019 while bus ridership was 76.6 percent. Actual October ridership was more than September’s, which is the case for most years.

As with last month, New York, Los Angeles, Miami, and Houston transit systems are much better than average, carrying 78 to 85 percent of 2019 levels. Washington seems to have caught up with the average, carrying 73.7 percent. Atlanta, Boston, Phoenix, and San Francisco are all doing worse than average, carrying less than 70 percent and, in Phoenix’s case, less than 56 percent of 2019 numbers. Continue reading

Throwing Good Money After Bad

The Federal Transit Administration has agreed to give Honolulu another $125 million to finish its insane rail transit line. Years ago, the FTA agreed to provide $1.55 billion for the rail line, but that was when the line was expected to cost $5.1 billion.

When projected costs exploded to $12 billion and the city proved to be an inept project manager, the FTA withheld about half of the promised money, saying that it didn’t believe the city would be able to complete the project. Now, after redesigning the system, negotiating with the FTA, and no doubt twisting some arms, the federal agency is handing over about 17 percent of the withheld funds. Continue reading

European Passenger Train Travel Declining

The media treat Americans to a constant drumbeat of how much better European passenger trains are and why we need to spend hundreds of billions or trillions improving our train system. The latest is a report that overnight trains are proving they can replace air travel by “play[ing] an important niche role on long-distance routes of between 500 and 1,000 miles.”

A look at the actual data reveal that, despite huge government subsidies to European passenger trains, rail was barely holding its own before the pandemic and has drastically declined since the pandemic. Between 2012 and 2019, the share of passenger travel carried by airlines grew from 11.6 to 15.0 percent while the share carried by trains grew only from 6.7 to 6.8 percent. Most of the growth of rail travel was at the expense of bus travel, which declined from 9.1 to 8.1 percent. Auto travel from 72.3 to 69.8 mostly because of low-cost airlines. Continue reading

MBTA’s State of Bad Repair

Back in 2003, the Massachusetts Bay Transportation Authority (MBTA) estimated it had a “state-of-good-repair” backlog of $2.3 billion (about $3.7 billion in today’s dollars). Proving that the people running the agency are incompetent, instead of fixing their backlog they decided to build a new 4.3-mile light-rail line that just happened to cost $2.3 billion.

One of MBTA’s light-rail trains. Although the MBTA operates several different light-rail lines, they are nearly all painted green and are known as the Green Line. Photo by Adam E. Moreira.

Congress became aware of the maintenance backlog for transit systems nationwide and since 2015 it has given out $26.65 billion in grants to fix tracks, vehicles, and stations. Problem solved, right? Continue reading

Evidence That Planners Are Dumb

The United States is not the only country where transit agencies are wildly spending on questionable projects that suffer huge cost overruns. In Canada, Toronto opened its first subway in 1954 at a cost of just $11 million per mile — $90 million per mile in today‘s U.S. dollars. The city is currently building a subway line that was supposed to cost almost US$1.0 billion a mile, but with cost overruns is expected to cost as much as US$1.4 billion a mile.

Toronto subway. Photo by Tim Adams.

Light rail in Canada has also undergone huge price inflation. Edmonton opened North America’s first modern light-rail line in 1978 at a cost of US$47 million a mile in today’s money. Today, Calgary, Hamilton, Kitchener, and Toronto are all planning or building light-rail lines that are expected to cost at least US$300 million a mile, and several of these have had cost overruns of as much as 180 percent. Continue reading

No Amount of Money Is Too Much

Is there any transit construction project that is so expensive that a transit agency will say, “Let’s not do this”? The Antiplanner has argued that the answer is “no”; instead, the only question agencies ask is, “Where are we going to get the money to do this?” Evidence for this view has recently come to light in San Francisco and Baltimore.

Architect’s model of the planned San Francisco transit center. Note the bottom level has commuter trains on the outer tracks and high-speed trains on the center tracks even though the prospects of high-speed rail ever reaching San Francisco are dimming every day.

Last January, I observed that the price of a 1.3-mile commuter-rail extension that San Francisco was planning had increased from $5.0 billion to $6.7 billion, or more than $5 billion a mile. I pointed out that there were several viable alternatives to spending what would be a record amount of money per mile on a transit project, including replacing the trains with buses or terminating the trains at a different location just seven minutes away. Now comes the news that the cost of the project has increased again to $8.25 billion, or more than $6.3 billion a mile. Continue reading

Transit Slowly Recovers

U.S. transit systems carried 73.9 percent as many riders in September 2023 as the same month in 2019, according to data released earlier this week by the Federal Transit Administration. This is transit’s highest level, as a percent of 2019 numbers, since the pandemic began. This is particularly remarkable as September 2023 had one less business day than September 2019.

Highway data for September 2023 are not yet available. This chart and post will be updated when they are released.

Transit was aided by the fact that September ridership in the New York urban area, where 46 percent of all transit rides take place, reached 78.6 percent of pre-pandemic numbers. Transit is also doing better than average in Los Angeles (79.3%), Miami (83.4%), Dallas (78.4%), and Houston (87.2%). Washington reached 73.8 percent, just slightly below the national average. Ridership continues to be below average in Chicago (63.1%), Philadelphia (59.4%), Atlanta (60.6%), Boston (64.0%), Phoenix (55.8%), and San Francisco-Oakland (64.4%), to name a few. Although transit ridership is slowly recovering, it is still well behind driving, which first reached 100 percent of pre-pandemic miles in June, 2021. Continue reading

States Shouldn’t Try to Reduce Per-Capita Driving

The most idiotic ideas come from articles written by anti-car writers. This isn’t recent, but a colleague from Washington let me know of a 2022 article from a “public interest” organization called the Frontier Group that reports that “less driving is possible.” Thanks to “compact neighborhoods” and “investments in infrastructure that supports walking, biking or riding transit,” some states have managed to reduce per-capita driving, which the Frontier Group regards as a victory.

To encourage transit while discouraging driving, Washington converted lanes on a bridge that had previously been open to all vehicles into light-rail lines. Image by Sound Transit.

As evidence, the author of the Frontier Group article, Elizabeth Redlington, compared miles of per capita driving by state in 1996 and 2021. Between those two years, some states increased but some declined and the biggest decline was in Washington state, which saw a 15.8 percent drop in per capita driving during that period. Continue reading

Why Bus-Rapid-Transit Has Become Popular

Am I ahead of my time or simply out of step with the times? When I began studying light rail, I quickly realized that buses could do everything light rail could do except cost a lot of money. I was especially heartened when Kansas City, whose voters had rejected light rail in something like eight different elections, spent about $3 million a mile (about $4 million a mile in today’s money) installing two bus-rapid-transit (BRT) lines and got 30 to 50 percent increases in ridership, which is more than some light-rail lines get.

So I should be happy about recent reports favoring BRT.

  • As noted above, the World Bank reports that “Bus Rapid Transit takes cars off the road and moves people quickly, providing the benefits of metros at a fraction of the cost.”
  • An article in Research in Transportation Economics found that the values of homes within a 20-minute walk of a bus-rapid transit station increased by 5 to 7 percent and the total increase in property values was six times the cost of the BRT projects.
  • Jarrett Walker reports “good outcomes” from a new BRT line in Portland, specifically a 30 to 40 percent increase in ridership.

Continue reading

32 Years of Transit Data

When the Federal Transit Administration released the 2022 National Transit Database, it also released updated time series data tables. These tables have operating data (including costs and ridership) from 1991 through 2022, capital costs from 1992 through 2022, and fare revenues from 2002 through 2022.

This chart shows ridership for six urban areas that I consider to be basket cases, with ridership steadily declining despite — or more likely because of — the construction of light-rail or some other transit infrastructure. Of course, ridership declined everywhere due the pandemic, but most of these are among the slowest to recover to their already low 2019 levels.

The release includes six data tables, but I find just two of them useful as they are the only two that break down data by mode. Table TS3.1 has capital costs by transit agency and mode. Table TS2.1 has all other information — operating costs, fares, service in miles and hours, ridership, passenger-miles, and miles of rail lines — by agency and mode. Continue reading