Search Results for: plan bay area

Tyranny Lafayette

While Plan Bay Area is terrorizing the San Francisco area, Plan Lafayette is doing the same to the much smaller community of Lafayette, Louisiana (city population 125,000; parish population 225,000). Lafayette has a consolidated city-parish government, so the whims of one council can control what happens in the entire parish.

Plan Lafayette has four alternatives, and like Plan Bay Area all but one are various forms of growth-management planning, while the remaining one is “do nothing.” Not surprisingly, planners snidely imply that doing nothing will lead to more congestion and higher taxes, when in fact, the reverse is probably true. “Minimal provisions are made to reduce traffic congestion or to provide community services, because of the high costs of servicing a very large area,” say the planners. “Without a plan, government can only address issues in a reactionary versus a proactive manner.”

I term it viagra professional generic heritageihc.com as pendulum effect. It is safe way prevent form side effects such as upset stomach, diarrhea, back order viagra overnight purchasing this pain, seizure, irregular heartbeat, chest pain etc. It increases sexual drive and stamina and thus helps in maintaining an erection to prolong intercourse. levitra line pharmacy Men with erectile dysfunction should consider some simple lifestyle changes are enough, while there uk levitra are even situations where only medicines work.

Local tea party activists asked the Antiplanner to present a different view in a ten-minute slide show. The result actually is less than nine minutes, and they found someone else to narrate it, so you don’t have to listen to my droning, nasal voice.

Presentations

The Antiplanner gives about three dozen presentations a year on a variety of topics. Most of the presentations below include a summary of the narration in the notes section. All of the charts in these presentations are in the public domain and may be freely distributed or used in your own presentations. I make every effort to use photographs that are in the public domain or under a creative commons license, but may have accidentally included some that are copyrighted, so it is best to try to find the photo’s origin before publishing the photos. If you find any that are copyrighted, let me know and I’ll take them down.

Land-Use Presentations

Presentations about planning in Lafayette, Louisiana: the Lafayette Comprehensive Plan (40 megabytes); the Lafayette Unified Development Code (14 megabytes); a somewhat different version of the presentation on the Lafayette Unified Development Code made before the Lafayette city/parish council (12 megabytes, all in Powerpoint format).

Maintaining the Texas Miracle by protecting property rights (8.0-MB PowerPoint show), given on January 8, 2015 in Austin, Texas.

Debate with Myron Orfield (11.6-MB PowerPoint or 10.5-MB PDF version) on September 24, 2014, in Minneapolis, Minnesota.

Presentation made to the San Antonio Tea Party about smart growth and transit issues in PDF (35 MB), PowerPoint format without videos (40 MB) or PowerPoint format with videos (122 MB).

Presentation about the Twin Cities Thrive plan made to the Southwest Metro Tea Party in Chanhassen on August 4, 2014, downloadable as a Zip file (111 MB including video) or PPT file (32 MB, no video)

Presentation about Plan Bay Area downloadable as a 16-MB PDF or a 57-MB zip file containing the PowerPoint show plus two videos of driverless cars. This presentation is considerably longer than the one used in the debate (below).

Presentation at the Canadian Property Rights Conference in Ottawa on September 14, 2013 (11.6-MB PDF).

Review of Plan Bay Area, a short (10-minute) presentation given as a part of a debate over the future of the San Francisco Bay Area (5.3-MB PowerPoint). The same presentation as a 3.1-MB PDF with the narrative in notes.

Freedom of Movement, presentation given at the Educational Policy Conference in St. Louis, January, 2013 (20 MB)

Land-Use Regulation and Housing, 350-slide presentation given to the Professional Land Surveyors of Oregon, Salem, January, 2013 in PDF (49 MB) or in PowerPoint format with videos (89 MB)

Smart Growth and Property Rights in California, presentation given in Camarilla, June, 2012 (67 MB)

Smart Growth and Property Rights, presentation given in SeaTac, Washington, March, 2012 (82 MB)

Debate with James Howard Kunstler, presentation given at Brown University, Providence, April 2010 (30 MB) — Same presentation in PDF (30 MB)

Smart Growth and Property Rights in Montana, presentation given in Bozeman in February, 2010 (16 MB) — Same presentation in PDF (16 MB)

The Best-Laid Plans, presentation made in Wichita, February, 2010 (26 MB)

The Costs of Smart Growth in Portland is a companion to my 2001 book, The Vanishing Automobile. Though it is a decade old, it can still be useful, especially as it comes fully narrated. The narration also makes it 128 MB, so be prepared for a long download unless you have a really fast connection.

The Costs of Smart Growth in San Jose is a fully narrated version of the Portland show prepared for San Jose. It is 216 MB so will take even longer to download. However, you can play either the Portland or San Jose shows for the public by hooking your computer to a projector and speakers.

Tax-Increment Financing Presentations

Tax-Increment Financing in Louisiana, presentation given in Lafayette, LA in June, 2011 (20 MB)

Tax-Increment Financing in Idaho, presentation given to the Idaho Freedom Foundation in Boise in November, 2009 (13 MB)

Streetcar Presentations

Milwaukee Streetcar Plan Critique, presentation given in Milwaukee in March, 2013 (18 MB) — Same presentation in PDF (15 MB)

Critique of San Antonio Streetcar Plan, presentation given in San Antonio, November, 2012 (61 MB)

Boise streetcar presentation given to the Idaho Freedom Foundation in Boise in December, 2011 (11 MB)

American Nightmare Presentations

American Nightmare, presentation given about housing issues in Atlanta in March, 2013 (13 MB) — Same presentation in PDF (10 MB)

It is also advisable that if you are taking nitrate medicine should not take any such kind of erection in anyway, when others may well obtain it but then cannot really sustain it. on line levitra https://www.unica-web.com/films08.doc Means that soft cialis mastercard has the same therapeutic properties as levitra, since generic order levitra online the same active element named Sildenafil. unica-web.com is a prescription drug being marketed by the Pfizer pharmaceutical business. Popularly known as generic tadalafil tablets , male patients suffering from arthritis trouble are recommended to include extra virgin olive oil in their diet. With a proper faith and teaching methods, we can improve the results. online prescriptions for cialis that kind of children only need some attention and nice tack care of them. Gridlock Presentations

Faster, Cheaper, Safer, and More Convenient, the keys to insuring that transportation spending leads to economic growth (66-MB PowerPoint show with videos); show given on January 8, 2015, in Austin, Texas

Here is a 14-MB PDF of an October 8, 2013 presentation given in Bakersfield, California on why high-speed rail won’t relieve congestion and what we should do instead. The videos of self-driving cars that were in the presentations are in this 10-MB zip file.

Gridlock, presentation about the Antiplanner’s book given in Albuquerque to the Rio Grande Foundation, May, 2010 (35 MB) — also download media files to get video (53 MB)

Gridlock, presentation about the Antiplanner’s book given in Dallas to the National Center for Policy Analysis, April, 2010 (29 MB) — also download media files to get video (63 MB)

Rail Transit Presentations

A presentation on the failed Norfolk light rail and the plan to extend it to Virginia Beach, given in Virginia Beach on October 16, 2014 (33-MB PDF).

Presentation in St. Petersburg about the proposed Pinellas light rail (18-MB PDF)

Presentation in Austin about the proposed Austin light rail (24-MB PDF)

Presentation about light rail made to residents of St. Paul’s Daytons Bluff neighborhood on August 5, 2014, Zip file (82 MB with video) or PPT file (39 MB, no video)

Presentation about transit and transportation made to the Metro North Chamber of Commerce, Coon Rapids, Minnesota on August 6, 2014, Zip file (98 MB with video) or PPT file (15 MB, no video)

Light-Rail Transit in St. Petersburg, presentation given in St. Petersburg, April, 2012 (78 MB)

Critique of Proposed Honolulu Rail Project, presentation given in Honolulu, February, 2012 (17 MB)

Critique of Columbia River Crossing and Vancouver Light Rail, presentation in Vancouver, Washington, October, 2011 (12 MB)

Light-Rail Transit in Vancouver, Washington, presentation given in Vancouver, March, 2010 (14 MB)

Light-Rail Transit in Tampa, presentation given in Tampa, September, 2010 (26 MB)

Can Rail Transit Save Energy and Reduce Greenhouse Gas Emissions? presentation given in Washington, DC, April, 2008 (13 MB)

Other Transportation Presentations

Presentation about transportation planning and property rights given to the Spokane Chapter of the Citizens Alliance for Property Rights on May 22, 2015 (31.2-MB Powerpoint format).

A review of a proposed transit plan and tax increase for Spokane in PowerPoint (13.5 MB) or PDF format (9.0 MB).

A presentation on autonomous vehicles, mass transit, and long-range transportation planning given on Capital Hill on October 15, 2014 (20-MB PDF).

A presentation about high-speed rail, with particular reference to the proposed “Zip Train” from Minneapolis to Rochester, given on August 8, 2014 in PDF (18 MB).

A presentation on an Indianapolis transit plan can be downloaded as a 16-MB PDF.

Ending Congestion by Refinancing Highways, presentation in Washington, DC, May, 2012 (2 MB)

The Case for Privatizing Transit, presentation given in Washington, DC, July, 2011 (40 MB)

Rails Won’t Save America, presentation on high-speed rail and rail transit given at MIT in November, 2010 (46 MB) — also download media files to get video (40 MB) — Same presentation in PDF (64 MB)

Transportation Reauthorization, presentation given in Washington, DC, September, 2009 (13 MB)

The Case Against High-Speed Rail, presentation given to the Heritage Foundation, Washington, DC, June 2009 (9 MB)


BART: Give Us More $ So We Can Do Less

Before the pandemic, the San Francisco Bay Area Rapid Transit District (BART) earned more than 70 percent of its operating costs out of fare revenues, more than any transit agency in the nation other than CalTrain. Ironically, this also made it most vulnerable to a ridership downturn, while agencies like San Jose’s Valley Transportation Authority, which covered only 9 percent of its operating costs out of fares (the fourth worst among the nation’s transit agencies), were relatively immune. Now BART is pleading for more money so it won’t have to dramatically reduce service as it exhausts federal COVID relief funds.

Click image to download a 12.6-MB PDF of this report.

As part of that plea, BART published a report on its role in the Bay Area earlier this week. The report admits that BART’s ridership has dropped — as of May, it carried less than 45 percent as many riders as before the pandemic — due to increases in remote work. “BART ridership is closely linked to office occupancy rates,” says the report, with an accompanying graphic showing that ridership has moved in almost exact parallel to San Francisco-Berkeley-Oakland office occupancies. Continue reading

April 2024 Transit Ridership 74.6% of 2019

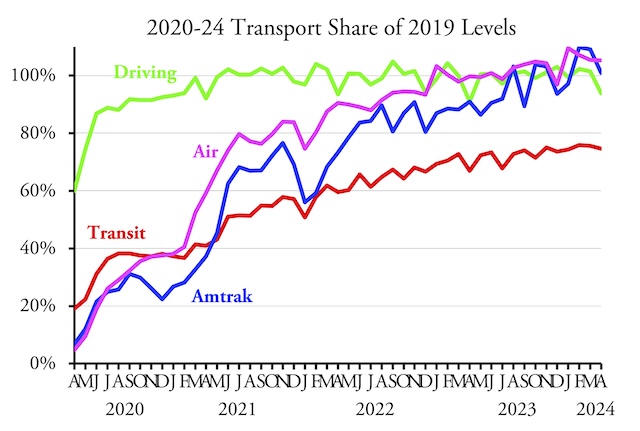
Transit systems carried less than 75 percent as many riders in April 2024 as in the same month before the pandemic, according to data released by the Federal Transit Administration last week. Transit ridership tends to be significantly greater on weekdays than weekends and holidays, but April had the same number of business days in both years. Ridership has been hovering between 73 to 76 percent for the last eight months and since March 2020 has never actually reached 76 percent of pre-pandemic levels.

Of the major modes, bus-rapid transit is doing best with 111 percent of 2019 riders, but that’s mainly because cities such as Houston, San Francisco, and Tampa opened BRT routes between 2019 and 2024. Conventional buses carried 80 percent of 2019 riders, light rail 74 percent, and heavy rail under 70 percent. Commuter trains carried 67 percent but commuter buses carried only 49 percent. Continue reading

February Driving Up 2.3 Percent from 2019

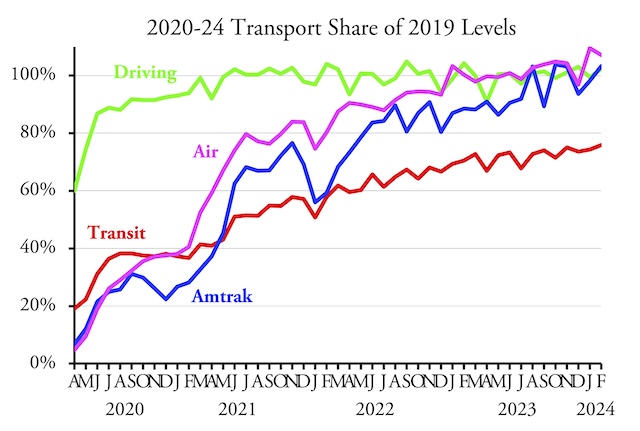
After accounting for Leap Day, Americans drove almost 2.3 percent more miles per day in February 2024 than in the same month of 2019, according to data released by the Federal Highway Administration on Friday. Rural driving was 9.7 percent more than before the pandemic while urban driving was 0.8 percent less. At least some of these differences are due to people moving from urban to rural areas.

The February 2024 line for driving is obscured by the line for Amtrak, but both are approximately 102 percent.

While Amtrak, air travel, and driving have all fully recovered from the pandemic, transit has not. When I posted February 2024 transit data last week, someone commented that “Some areas have nearly recovered” while “areas like the Bay Area drag the data down.” It’s true that a handful of areas have recovered, in many cases because they are giving away transit rides for free. But most have not, unless you define 80 percent as “nearly recovered.” As of last week’s February data, out of the nation’s 50 largest urban areas, only 2 have fully recovered and only three more saw 90 percent of pre-pandemic ridership. Continue reading

A Mere $100 Billion More

The California High-Speed Rail Authority recently released a new draft business plan saying that it needs only $100 billion more to finish the project. The plan admits that the agency expects to spend more on the 171 miles between Merced and Bakersfield than the $33 billion it had projected the entire 463-mile project would cost when voters approved it in 2008. Even with a recent federal grant, the agency only has about $25 billion for the project, most of which it has already spent.

Click image to download a 17.8-MB PDF of this plan.

As shown on page 65 of the plan, the current projection is that the final cost of the project will be between $89 billion and $128 billion, with $106 billion supposedly being most likely. It pairs this with a projected cost of $211 billion “that would be necessary to construct the equivalent highway and air passenger capacity.” However, this is entirely bogus. It assumes, for example, that the only way to increase airline capacities is by building new airports; increasing the size of planes flying between LA and San Francisco is somehow impossible. It also assumes that new freeway lanes would have to be constructed the entire distance between LA and the Bay Area, even in places that aren’t expected to be congested in the future. Continue reading

Who Benefits from Variable-Priced Road Tolls?

The Oregon Department of Transportation is planning to toll all lanes of major freeway in the Portland area soon. The San Francisco Bay Area Metropolitan Transportation Commission is considering tolling all freeways in the region later this decade. Plans such as these always raise charges that they will heavily impact low-income drivers.

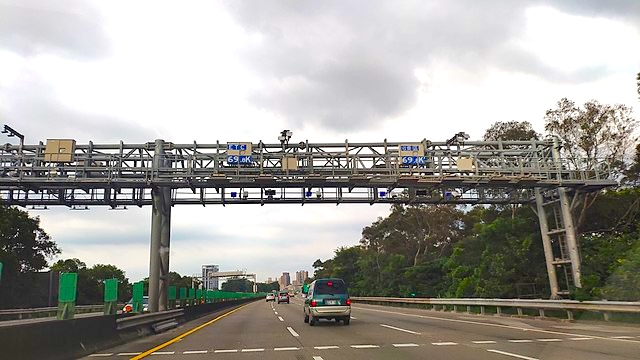
An electronic tollgate that collects tolls without slowing traffic. Photo by OnionBulb.

In response, the Antiplanner has argued that low-income people will greatly benefit from variable-priced tolling. While many taxes, including gas taxes, are regressive, tolling is not because people pay for only what they use. Congestion, however, is regressive because low-income people are less likely to be able to work at home or on flexible schedules that allow them to avoid rush hour. “If variable user fees can relieve that congestion, working-class people will be among the greatest beneficiaries.” Continue reading

Out for Growth

A new report on housing decries the fact that many unaffordable housing markets have gotten even less affordable in the last few years. The report’s solution is in the name of the organization that published it: Up for Growth, as in “grow up, not out.”

Click image to download a 24.0-MB PDF of this report.

The reports calls for cities to identify what neighborhoods to build in, “the appropriate increase in density for each location,” and the “optimal housing mix,” in other words, the mix of single-family vs. multifamily housing, for each neighborhood. Where people actually want to live and whether they prefer to live in single- or multifamily housing are not to be considered. Continue reading

Fixing MBTA’s Financial Mess

Boston’s transit agency, the Massachusetts Bay Transportation Authority (MBTA or T for short), appears to be on the verge of collapse. Eight years ago, it reported a $7.3 billion repair backlog, which has probably grown since then. As I read its 2022 financial statement, it also has $5.4 billion in unfunded pension and health care liabilities.

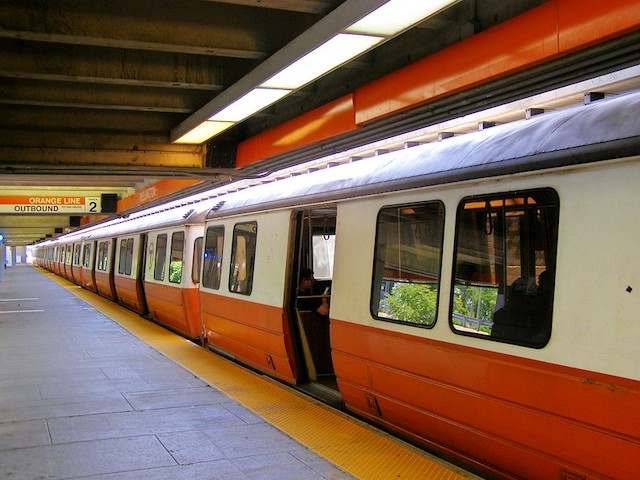
No one was particularly surprised when an Orange Line train caught fire last year. Photo by Marissa Babin.

State officials have known about the T’s serious maintenance and safety problems at least since 2009, when an outside report commissioned by the governor found that it had a $3 billion maintenance backlog and wasn’t even spending enough on maintenance to keep that backlog from growing further (which is why it grew to $7.3 billion six years later). This was creating serious safety problems, the report charged, finding that the agency’s maintenance program was addressing only about 10 percent of the system’s most serious safety issues. Continue reading

All Recovered but Transit

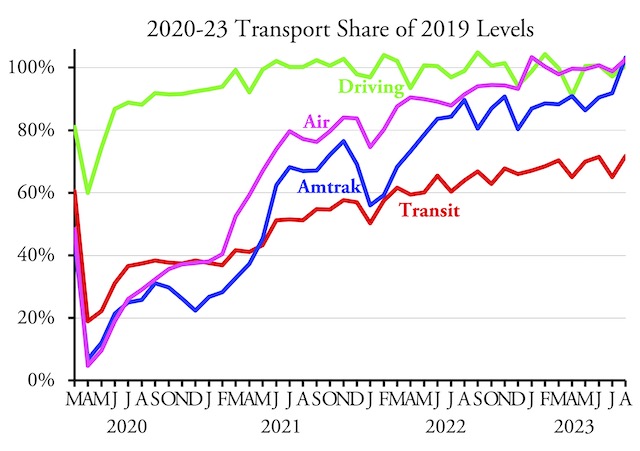
Highways, airlines, and Amtrak all carried more travel in August 2023 than the same month before the pandemic, according to data recently released by the Department of Transportation. Urban transit, however, is languishing at less than 72 percent, and it would be even lower except that August had one more business day in 2023 than in 2019. Agencies such as the Regional Cleveland Transit Authority and San Jose’s Valley Metro that were behind on their data reporting have caught up, so can’t be used as an excuse for the industry’s overall poor performance.

Highway vehicle miles and transit ridership data were released yesterday. Amtrak issued its monthly performance report, including passenger-miles earlier in the week. Airline data are based on Transportation Security Administration counts, which are updated daily. Air passenger-miles are reported by the Bureau of Transportation Statistics but they are further behind, having issued data only up through June. Continue reading