July 2023 Transit Ridership 65% of July 2019

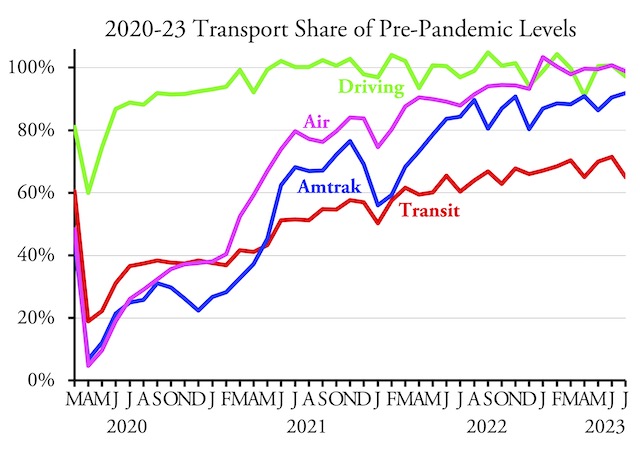
After reaching 70 percent of pre-pandemic numbers in June, transit ridership in July fell back to 65 percent of July 2019, according to data released last week by the Federal Transit Administration. Since July 2019 had 22 working days while July 2023 only had 20, this decline is not surprising.

Meanwhile, Americans drove 97.2 percent as many miles in July 2023 as in the same month of 2019, according to Federal Highway Administration data released last week as well. Amtrak’s monthly performance report indicates that the railroad carried 91.2 percent as many passenger-miles in July 2023 as July 2019, while the Transportation Security Administration says that 98.8 percent as many travelers passed through security in July as in 2019. Continue reading

Driver Shortage; Money Shortage; What to Do?

Transit agencies are “scrambling” to find funding to keep operating in the face of permanently lower ridership. At the same time, driver shortages are hampering agencies’ ability to keep running buses and trains.

This driver was so overworked that she fell asleep at the wheel and crashed into a utility pole. Yet the bus she was driving was empty, so why were she and the bus there in the first place?

There’s an easy solution to both problems: reduce service. Why run buses and trains that are nearly empty? Ridership isn’t going to come back just because the transit vehicles are there. Cutting service to the levels agencies can afford to operate without further subsidies will also help alleviate driver shortages. Reducing service will in turn reduce greenhouse gas emissions and improve social equity because most of the taxes that would be needed to maintain service are regressive.

June Transit Carried 71% of Pre-COVID Riders

America’s transit agencies carried 71.4 percent as many riders in June 2023 as they did in the same month of 2019, according to data released by the Federal Transit Administration yesterday. This is the highest percentage of 2019 ridership since February, 2020. One reason for the gain above previous months is that June had two more business days in 2023 than it did in 2019.

Data are not yet available for highway or Amtrak travel. However, boarding numbers from the Transportation Security Administration indicate that the airlines carried 100.8 percent as many riders in June of 2023 as June of 2019. I’ll post updates for driving and Amtrak when those data are released. Continue reading

Transit’s Minuscule Share of 2021 Travel

Public transit carried 6.4 percent of 2021 motorized passenger travel in the New York urban area. It also carried 1.6 percent in Honolulu, 1.5 percent in San Francisco-Oakland, 1.4 percent in Seattle, 1.2 percent in Chicago, and 1.1 percent in Salt Lake City. In every other urban area it carried less than 1 percent; nationwide, transit carried just 0.7 percent of all motorized urban travel.

Chicago transit carried 1.2 percent, autos the other 98.8 percent of motorized passenger travel.

I calculated these numbers by comparing passenger-miles in the 2021 National Transit Database, which was released last fall, with daily vehicle miles of travel (DVMT) by urban area in table HM-72 of Highway Statistics, which was recently released by the Federal Highway Administration. To make the numbers comparable, I multiplied DVMT by 365 to get annual data and by 1.7 to account for vehicle occupancies, 1.7 being the result when dividing passenger-miles by vehicle-miles in Highway Statistics table VM-1. These numbers don’t include walking, bikes and e-bikes, or scooters, but they do include motorcycles. Continue reading

Cities More Accessible in U.S. Than Europe

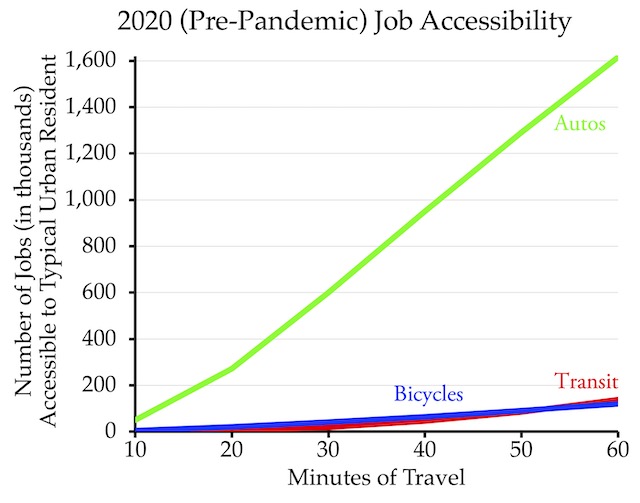
“Should the U.S. repair crumbling roads and highways to enhance car-based mobility or replace them with new public transit infrastructure that re-orients U.S. commuting systems away from their current car dependence?” asks a paper recently published by the National Bureau of Economic Research. To answer the question, the paper compared accessibility via transit and driving in about 50 U.S. and 50 European cities. If transit made European cities more accessible, the researchers reasoned, then it would make sense for the U.S. to emphasize transit as well.

Should the United States attempt to build as much transit infrastructure as is found in Europe even if doing so reduces people’s access to jobs and other economic opportunities?

Instead, the researchers — two economists from Yale and one from UC San Diego — found that U.S. urbanites had far more access to their cities than Europeans did in theirs. Moreover, Europeans using cars had far more access to their cities than those who relied on transit. This shouldn’t be a surprise to those familiar with the research published by the University of Minnesota’s Accessibility Observatory, but it seems to have surprised the people doing this research. Continue reading

Transit Continues to Lag Behind Driving

Americans drove more miles in May 2023 than the same month of 2019, according to data released by the Federal Highway Administration earlier this week. Transit ridership, however, was still less than 70 percent of 2019 levels, according to the Federal Transit Administration’s latest data.

At 69.9 percent of pre-pandemic levels, transit ridership was very close to 70 percent, a threshold it has breached only once since March 2020. To be fair, Cleveland’s regional transit agency is late in reporting ridership numbers. Though the agency carries only 0.3 percent of the nation’s transit riders, when its numbers are added, the national total for May will slightly exceed 70 percent of 2019. Continue reading

Transit Fatalities Set Record in 2022

Urban transit killed more people in 2022 than any year in recent history, according to data released last week by the Bureau of Transportation Statistics. The numbers show that 340 people were killed in 2022, up from 268 in 2019 and 237 in 1990. No data are available from before 1990, but it is likely that transit fatalities were less than 300 per year going back to at least 1960.

This figure shows 2022 transit fatality rates and the urban road fatality rate for 2021, as 2022 data aren’t yet available.

This rise in fatalities is particularly concerning considering that transit agencies operated only about 86 percent as many vehicle-miles of service in 2022 than they did in 2019. Despite a 14 percent reduction in service, fatalities rose by 27 percent. Continue reading

Transit’s Insatiable Appetite

A few weeks ago, the Antiplanner reported that transit advocates were holding up rush hour traffic in San Francisco in order to blackmail the legislature into giving billions of dollars to transit systems that few people are riding anymore in order to prevent a fiscal cliff. I also noted that the blackmail worked as the state gave transit $2 billion including $1.1 billion for BART.

Is there a fiscal cliff ahead? Photo by Cary Lee.

Fiscal cliff averted! Except state senator Scott Weiner wants to “temporarily” raise Bay Area bridge tolls by $1.50 (from the current $7) for five years in order to provide more subsidies to transit. The increase will only be needed for five years, Weiner says, because by then he hopes Bay Area voters will have passed another tax increase to support transit systems they are no longer using. Continue reading

Transit Not Reinventing Itself

Transit “systems are asking their local governments for bailouts as federal pandemic relief runs dry,” says the New York Times, “but they are also racing to reinvent themselves.” No, they are not.

Source: the Monthly Review: An Independent Socialist Magazine.

The examples of “reinvention” the Times gives mostly involve eliminating fares. But if the problem is that reduced ridership has impacted agency revenues, eliminating fares won’t restore those revenues. That’s not reinvention; it’s merely stepping up the subsidies and the need for even more bailouts. Continue reading