November Transit Reaches 56.2% of Pre-Pandemic Riders

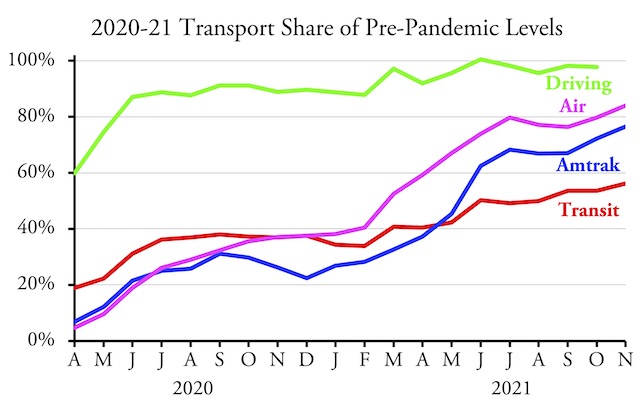
The nation’s transit systems carried 56.2 percent as many riders in November 2021 as in November 2019, according to data released by the Federal Transit Administration on Friday. Though an improvement over October’s 53.5 percent, transit still lags behind the airlines, at 84.0 percent, and Amtrak, at 76.6 percent.

Amtrak numbers from its Monthly Performance Report; airline numbers from the Transportation Security Administration; November highway numbers will be available in a week or so.

Transit bus ridership numbers were up to 60.5 percent of pre-pandemic levels while rail numbers reached 52.2 percent. Ridership has still failed to reach 50 percent of pre-pandemic numbers in Detroit (35.4%), San Francisco-Oakland (45.0%), Washington DC (45.5%), Sacramento (48.4%), San Jose (49.1%), and Chicago (49.8%). At the other extreme, ridership has recovered the most in Los Angeles (72.1%), San Diego (64.7%), Tampa-St. Petersburg (63.9%), Las Vegas (63.4%), Dallas-Ft. Worth (62.6%), Houston (61.2%), and San Antonio (60.6%). The New York urban area, which produces about 45 percent of all transit numbers in the U.S., was slightly above average at 58.3 percent. Continue reading

Derailed by Lies

The Washington Metropolitan Area Transportation Authority (WMATA) has announced that it is “taking swift actions” to “combat the omicron variant.” What are those actions? It is cutting weekday bus service to Saturday schedules. Plus it is keeping rail service on limited schedules.

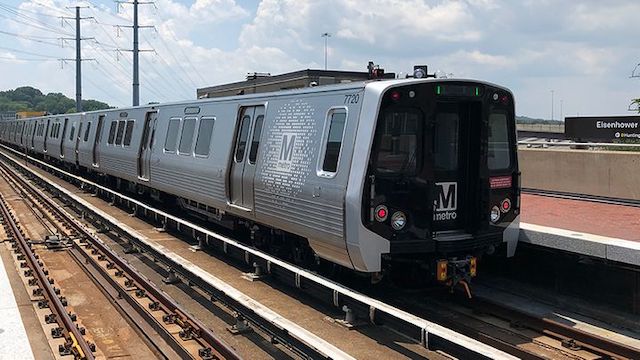
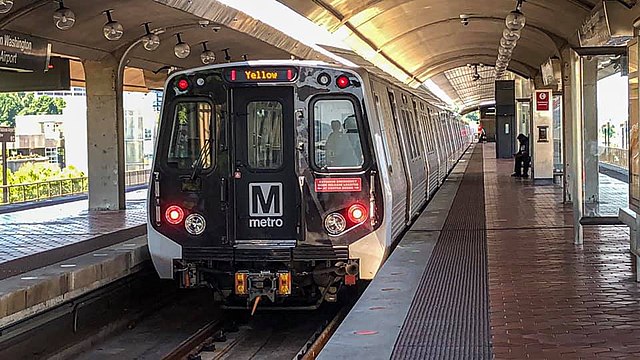
A train of derailment-prone 7000-series railcars.

How will these actions combat the omicron variant? They won’t. But WMATA doesn’t want to admit that, as a contender for the title of worst-managed transit agency in America, it purchased a bunch of rail cars that are duds and keep falling off the tracks. Because those railcars make up more than half the agency’s fleet, service alerts (at the time I am writing this) urge rail riders to “expect delays and consider MetroBus alternatives.” Continue reading

Traffic Jam Is Glenn Youngkin’s Fault

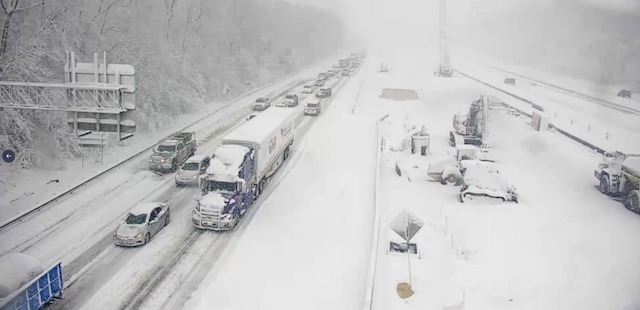
The first rule of politics is to blame your enemies for anything bad that happens in the world. So when Interstate 95 was locked in a weather-related traffic jam for 15 hours, progressives were quick to blame it on newly elected governor Glenn Youngkin.

Photo by Virginia Department of Transportation.

“Looks [like] Youngkin failed his first test in Va,” writes one. “This is not a good start or look for Virginia’s Gov. Glenn Youngkin,” says another. Continue reading

Brightline Still a Killer

Two people died last week when their car was struck by a Brightline train in Aventura, Florida. That made a total of five fatalities to Brightline trains in December alone. Railroad officials were quick to blame the latest accident on the auto driver, who drove “around the gates, which were down, flashing and bells ringing, signaling an approaching train.”

Google street view at or near the location where two people were killed in their car last week while trying to cross Brightline tracks. Not only do the crossing gates not cover the entire width of the road, there are no fences to keep pedestrians off the rail right of way.

Americans are morons,” a railroad conductor commented on a Jalopnik article about the accident. But who is the moron: the person who drove around the crossing gates or the person who decided to run 79-mph passenger trains on tracks whose crossing gates had been installed when the only trains running on those tracks were 40-mph freights? Continue reading

$30 Trillion National Debt in 2022

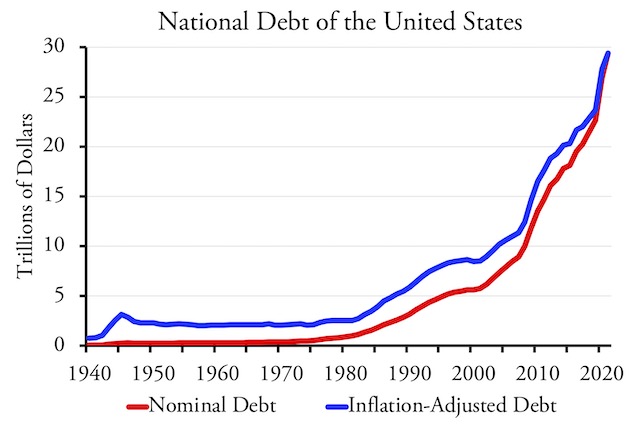
Few people other than debt watchdogs noticed when the national debt reached $29 trillion last month. The debt has been rising at more than a trillion dollars per year since 2017, so it is almost certain to reach $30 trillion sometime in 2022. The Office of Management and Budget actually predicted it would exceed $30 trillion by the end of 2021, but it didn’t quite make it.

Although the national debt has long been a subject for debate, it didn’t start growing rapidly except in wartime until the late 1970s. Why then? My theory is that the post-Watergate election brought so many liberal Democrats into Congress that they were able to strip fiscally conservative Southern Democrats of power, and the latter were no longer able to serve as guardians of the public purse.

Just for perspective, $29 trillion is more than $87,000 per resident. Although the latest numbers for other countries are hard to come by, it is likely that only Japan has a greater per capita national debt. Back in the 1960s, national debt per capita was about $1,500. I remember thinking, “I don’t have $1,500, but I could probably earn that if I had to in order to pay my share of the national debt.” Today, when 40 percent of Americans can’t cover an emergency expense of $400, I doubt many would be able to repay an $87,000 debt. Continue reading

Finding Sleep in Dense Cities

Here’s something Californians can look forward to as urban planners force higher densities on existing neighborhoods and urban areas: buses for sleeping. A company in Hong Kong, one of the densest cities in the world, is offering “bus sleeping tours” of the city, 51-mile trips aimed at allowing residents to get a little shut-eye.

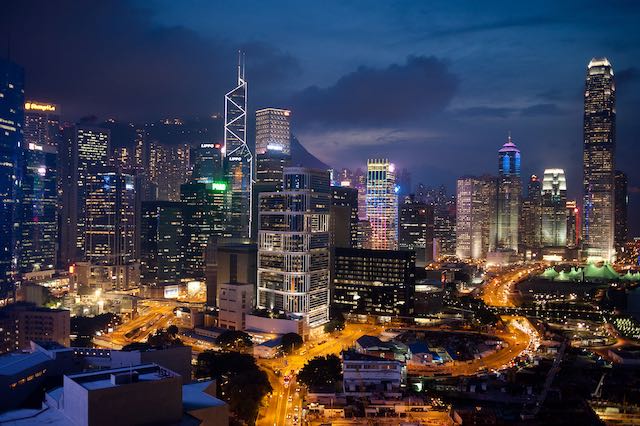
Hong Kong, the city where it’s hard to sleep. Photo by Tomas Forac.

Hong Kong is one of the most sleep-deprived cities in the world, with 70 percent of residents saying they have trouble sleeping. Obstacles to sleep include light pollution, noise pollution, and the presence of so many attractive bars and restaurants within walking distance of everyone’s homes. That’s exactly what planners want for California cities, and anyone who objects is called a racist. Continue reading

Transit Agencies Can’t Spend Money Fast Enough

You have to feel sorry for transit agencies. Congress gave them $69 billion COVID relief funds and $40 billion in the infrastructure bill on top of a $14 billion annual federal subsidy. But, due to labor shortages, agencies can’t find enough workers to drive around their nearly empty buses and trains.

The Washington Metrorail 7000-series cars don’t look much different from earlier series of cars. But, in addition to falling off the tracks a lot, they also come with the “feature” that they can’t be operated in tandem with earlier cars, whereas all earlier cars were compatible with one another. Another great example of your tax dollars at work. Photo by Swagging.

This threatens “the recovery of city life,” warns the Washington Post. Give me a break. Most workers aren’t going back to work in the cities and most of those who are don’t want to take transit. For some reason, though, reporters think that transit, unlike any private business, should be exempt from having to cut back service just because few people use it. Continue reading

The New York Subway Was Never Private

My friend Scott Beyer, who calls himself a market urbanist, has his heart in the right place but often has his facts wrong. He thinks he believes in free markets, but he loves transit so much that he can’t accept that, in a true free market, most transit would disappear.

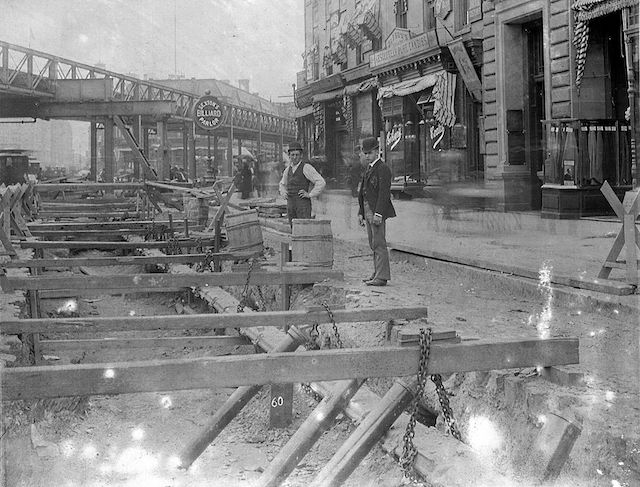
New York City subway construction, entirely paid for by taxpayers, in 1901.

His latest article asks if America will “get private subways (again)?” The article makes it clear that he believes the New York City subways were built with private money. Nothing could be further from the truth. Continue reading

Transit’s Fiscal Cliff

Transit officials in the San Francisco Bay Area say that transit there faces a “fiscal cliff” because ridership is so slow to recover from the pandemic. The Bay Area Rapid Transit District is in particular distress, say officials, because pre-pandemic fares covered a much higher percentage–the article says two-thirds but in 2019 it was actually 72 percent–of its operating costs than most transit agencies, so a loss of patronage means a greater loss of revenues as a share of its budget.

Some transit riders wear masks, but many more aren’t riding transit. Photo by OC Transpo.

Of course, those officials don’t mention that, unlike bus agencies, BART spends more money on capital replacement each year than it does on operations. Since capital replacement is essential to keep the trains running, fares actually covered only 36 percent of its costs. Continue reading

U.S. Road Conditions and Performance in 2020

While Americans drove their cars only 84 percent as many miles in 2020 as in 2019, according to data recently published by the Federal Highway Administration, they drove semi-trucks 101 percent as many miles. These and other data are from the 2020 Highway Statistics, an annual compilation of data on the condition, use, and financial status of the nation’s highway network.

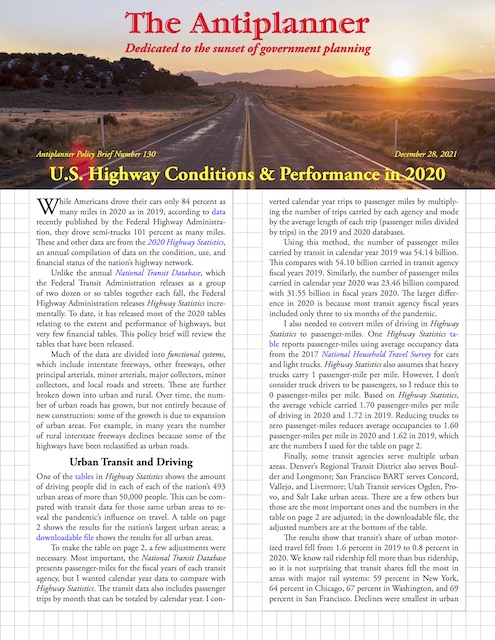
Click image to download a four-page PDF of this policy brief.

Unlike the annual National Transit Database, which the Federal Transit Administration releases as a group of two dozen or so tables together each fall, the Federal Highway Administration releases Highway Statistics incrementally. To date, it has released most of the 2020 tables relating to the extent and performance of highways, but very few financial tables. This policy brief will review some of the non-financial tables that have been released. Continue reading