Do New Roads Boost the Economy?

“More highway spending won’t rev up the economy,” argues a recent article in the Wall Street Journal. However, the article’s writer, David Harrison, seems a little confused about how highway spending might help the economy.

“The U.S. already has an extensive system of roads, so building more wouldn’t add much to productivity, economists say,” writes Harrison. But this depends entirely on where roads are built. Continue reading

Transit’s Post-COVID Recovery Is Slowest

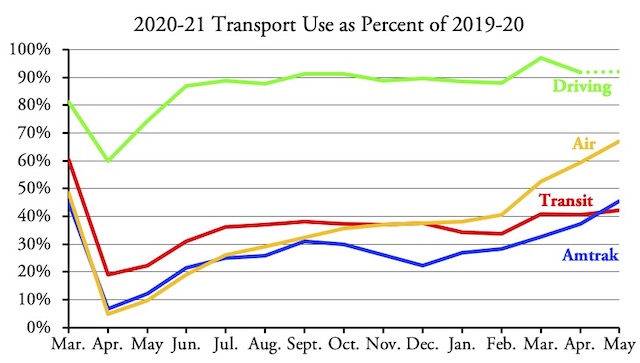
Amtrak’s May ridership surged to 45.2 percent of pre-COVID levels (as compared with May 2019), surpassing public transit, which reached only 42.3 percent of 2019 levels. Transit’s recovery was partly hurt by the fact that May 2021 had two fewer business days than May 2019, but the slow growth makes transit the least-recovered of the various modes of travel.

Shown are transit trips from the National Transit Database, and airline trips from Transportation Safety Administration, and Amtrak passenger miles from the May performance report. Driving is in vehicle miles from the Federal Highway Administration’s Traffic Volume Trends; May highway data won’t be out for another week or so.

As usual, rail transit is doing worse than bus transit when compared with 2019, but rail has also recovered more since 2020. Most of rail’s recovery is in heavy rail and commuter rail; light rail’s recovery is only slightly faster than transit buses and hybrid rail (meaning Diesel-powered light rail) isn’t even recovering as fast as buses. Continue reading

2021 Urban Mobility Report

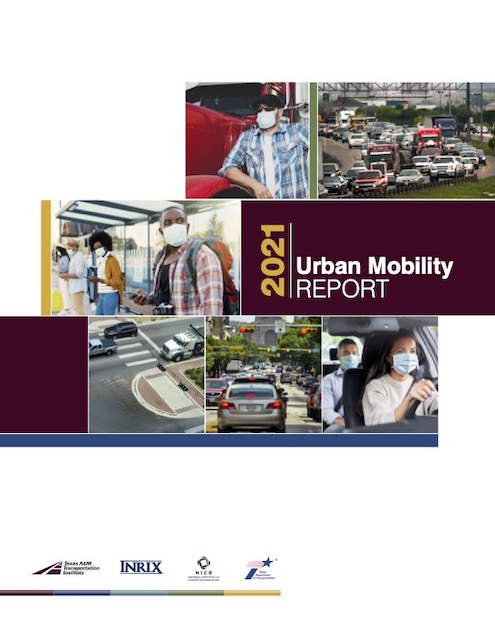
In what may be one of the most obvious reports ever, the Texas Transportation Institute has announced that congestion in 2020 was only about half as bad as congestion had been in 2019. The institute used to publish its congestion reports each year, but the 2021 Urban Mobility Report is the first in several years. The last report had data only through 2017, but this one goes through 2020.

Click image to download a copy of this report.

The report estimates that congestion cost commuters $190 billion in 2019, declining to $101 billion in 2020. Congestion also cost shippers $172 billion in 2019, falling to $95 billion in 2020. While these are interesting, if somewhat incomprehensible, numbers, the report doesn’t provide a lot of guidance about what to expect in the future. Continue reading

Oregon’s Mileage-Based Fee Program

CBS News reports on Oregon’s mileage-based user fee program, noting there is both support and opposition to the program. However, reporter Brook Silva-Braga notes that, not only that gas taxes aren’t working anymore, but that mileage-based fees can help relieve congestion.

Silva-Braka found someone who argued that charging user fees would hurt low-income people. But it would be better for low-income people to pay for what they use than to pay regressive taxes that often end up supporting programs used mainly by higher-income people. Continue reading

April Driving 92% of Pre-Pandemic Levels

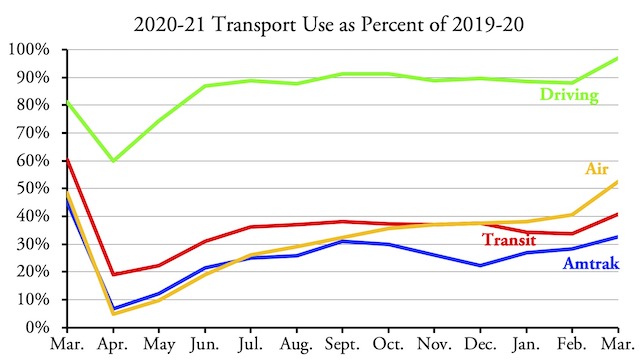
Americans drove 256.5 billion vehicle-miles in April, 2021, according to data released yesterday by the Federal Highway Administration. That’s a 55 percent increase over April 2020 and just 8 percent short of April 2019. As a share of pre-pandemic driving, however, it fell short of March, which saw 262.6 billion vehicle-miles or 97 percent of pre-pandemic driving.

March 2021 had 23 business days while March 2019 had only 21, which probably accounts for some of the increase in driving. April 2021 and 2019 each had 22 business days. Transit also had a slight bump in March vs. April, though nowhere near as large as the 5 percent increase (when compared with April) for driving. Continue reading

Traffic Fatality Rate Highest Since 2004

An estimated 38,680 people died in motor vehicle traffic accidents in 2020, a 7 percent increase from 2019, according to the National Highway Traffic Safety Administration (NHTSA). This is despite the fact that Americans drove 13 percent fewer miles in 2020 than they did in 2019. One caveat: the 2020 numbers are only preliminary based on a “statistical projection.”

The reported increase in fatalities pushed fatality rates up to 13.7 deaths per billion vehicle-miles traveled in 2020 and 1.45 in the last nine months of 2020, the highest rate since 2004. Fatality rates had declined to just 10.8 per billion miles in 2014, then hovered between 11 and 12 for the next five years.

The 2008 financial crisis led to a 1 to 2 percent annual decline in driving in 2008 and 2009, which resulted in a nearly 10 percent annual decline in fatalities. The pandemic led to a 13 percent decline in driving, yet fatalities increased. What was the difference between these two events that one made highways safer and the other made them more dangerous? Continue reading

Safe, Cost-Effective, and Equitable Transport

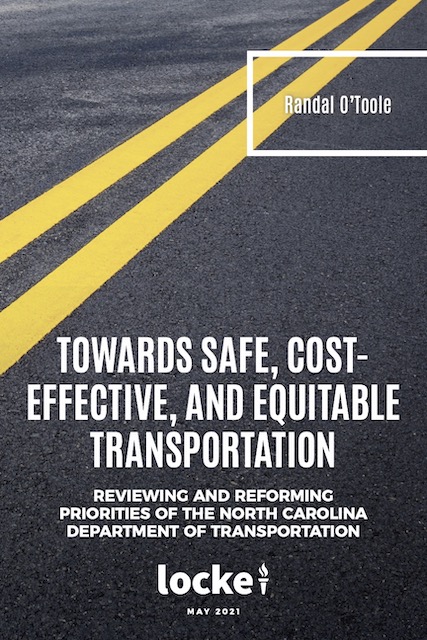
The North Carolina Department of Transportation (NCDOT) is not the worst state transportation department in the country, but neither is it the best. In 1921, North Carolina was one of the first states to impose a tax on gasoline and dedicate it to roads. It held to the user-pay principle for more than 60 years, but in 1984 it began diverting some of those fuel taxes to transit.

Click image to download an 11.5-MB PDF of this 108-page report.

Today, about 6 percent of NCDOT’s budget, which nearly all comes from highway user fees, gets spent subsidizing transit, Amtrak trains, and state-owned non-commercial airports. That doesn’t sound like very much, but the state is under pressure to increase that percentage. Continue reading

Columbia River Bridge Faces Opposition

The revived plan to replace the I-5 bridge over the Columbia River between Portland and Vancouver has been hammered by two liberal transportation experts in Portland. New Urbanist Joe Cortright calls it “vastly oversized and over-priced.” David Bragdon, former president of Metro, one of the agencies that wrote the original plan, documented years of falsehoods perpetrated by planners and called the proposal the “most expensive, stupid something” that could be done in the corridor.

As I noted recently, the plan called for a 12-lane bridge to serve a six-lane freeway. It also included a bridge for light rail even though voters in both Portland and Vancouver had rejected funding for this light-rail extension. Piling stupidity on stupidity, the plan called for a bridge that couldn’t open for ship traffic, and because light-rail trains couldn’t go up a steep enough grade to allow such traffic, planners proposed to buy out several existing shipping companies rather than leave light rail out of the plan.

Predictably, Cortright complains about the 12 lanes without ever mentioning the light-rail boondoggle. Bragdon only mentions light rail to suggest that the Washington Department of Transportation planned to stab Oregon in the back by deleting light rail from the project after it was approved. The reality is that both the 12 lanes and the light rail were insane and planners were crazy to propose a project whose 12 lanes would alienate the New Urbanists and whose light rail would alienate fiscal conservatives. Continue reading

VMT Recovers to 97.2% of Pre-Pandemic Miles

Miles of driving in March 2021 were 19 percent greater than March 2020 and just 2.8 percent less than March 2019, according to data released late last week by the Federal Highway Administration. This is the first time in more than a year that driving exceeded 93 percent of pre-pandemic levels.

Motor vehicles and highways have proven to be the most resilient form of travel during and after a pandemic.

At 99.7 percent, rural driving was nearly at 2019 levels. Urban driving lagged at 96.0 percent, but was still well ahead of urban transit. Continue reading

The Columbia River Crossing Rises Again

After being declared dead seven years ago, the proposal to replace the bridge over the Columbia River between Portland and Vancouver has been revived. Proponents of a new bridge have a web site that must be designed for Generation Z, as I find it pretty incomprehensible.

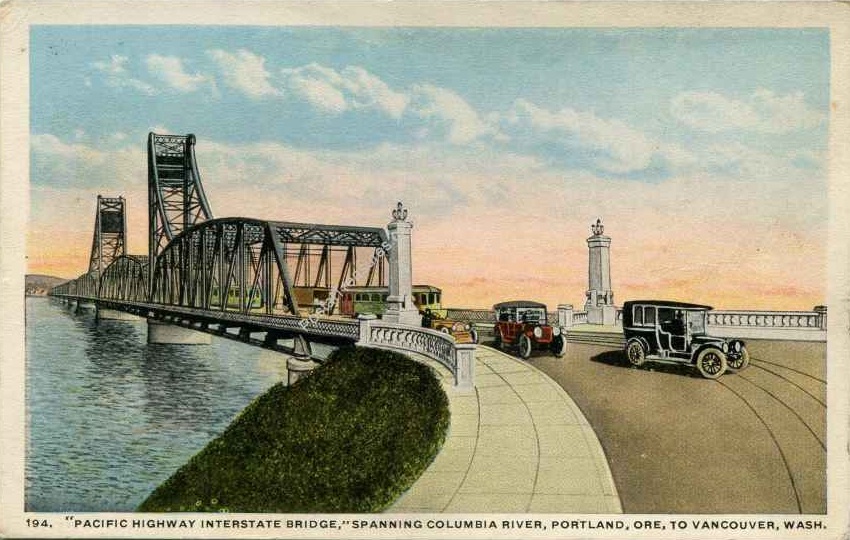
The original Pacific Highway bridge, now known as the Interstate Bridge, had two lanes of traffic including room for trolley cars.

Part of the existing structure opened as a two-lane bridge in 1917, and its capacity was doubled by building a duplicate bridge in 1958. Later the bridges were re-striped for three lanes to match the Interstate 5 freeway lanes north and south of the river. Continue reading