
Phoenix has seen the least increase in congestion of any major urban area in America. According to the data set accompanying the Texas Transportation Institute’s recently released 2019 Urban Mobility Report, the average commuter in Phoenix suffered from 80 hours of delay in 2017, up 26 hours from 1982. That compares with an 82-hour growth in delay per commuter in the San Francisco and Washington urban areas and an average 53-hour increase in delay for the nation’s top 50 urban areas.[*]
 Click image to download a four-page PDF of this policy brief.
Phoenix’s relatively small increase in traffic congestion is largely due to the massive increase in freeways in the region. According to an earlier edition of the urban mobility report, Phoenix had 210 lane-miles of freeways in 1982, growing to 2,015 by 2017. Part of this increase was due to an expansion of the urban area, leading to the addition of freeways that already existed but were previously outside the urban area. But the region has little more than doubled in land area since 1982 while the freeway lane-miles increased by nearly ten times. No other region has seen such a large increase in freeway lane-miles.
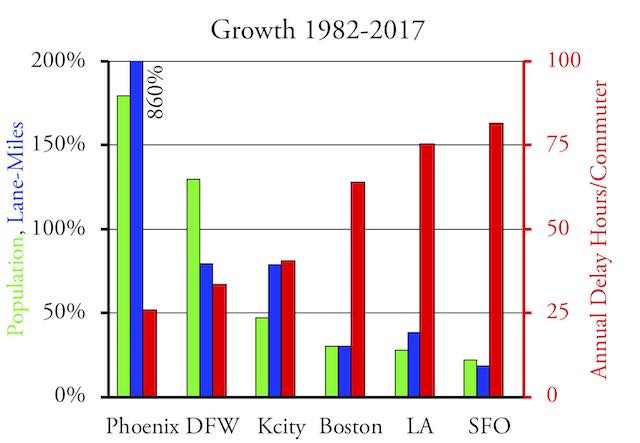
Adding hundreds of freeway lane-miles helped Phoenix, Dallas-Ft. Worth, and Kansas City have much smaller increases in congestion than regions that focused instead on transit.
Even with all this freeway construction, Phoenix hardly stands out in terms of miles of freeway either per capita or per square mile of land. The Boston, San Francisco, and Washington urban areas all have significantly more miles of freeway per person or land area. Where Phoenix stands out is in width: its freeways average 7.7 lanes wide. Only Los Angeles, at 8.8 lanes, is greater, though San Francisco is not far behind at 7.4 lanes.
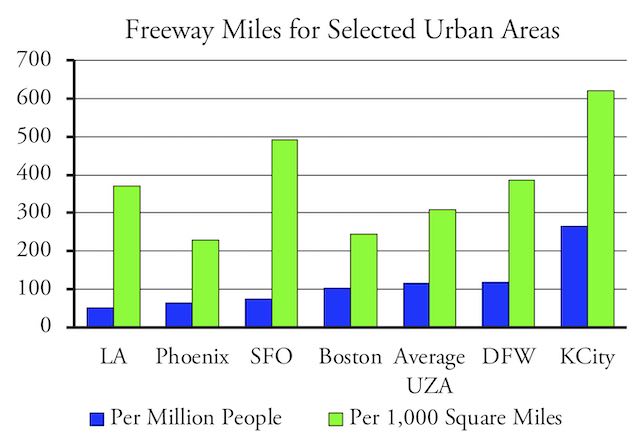
Despite recent additions, Phoenix is still below average in freeway miles per capita or per square mile of land, but partly makes up for it by having more lanes than average on its freeways.
Phoenix’s experience disproves the oft-repeated claim that “you can’t build your way out of congestion.” While the region’s overall congestion did increase, that growth was mainly off the freeways, as freeway driving per lane-mile grew by only 14 percent.
The 26 hours added to the average commuter’s annual delays is the smallest of any of the fifty largest urban areas. This was followed by Detroit (32 hours), Indianapolis (33 hours), and Dallas-Ft. Worth (34 hours). Although Detroit’s population stagnated in the last 35 years, Phoenix (which grew by 180 percent), Indianapolis (87 percent), and Dallas-Ft. Worth (130 percent) all were among the fastest-growing urban areas in America.
Meanwhile, much slower-growing urban areas saw congestion get far worse. Los Angeles and the San Francisco Bay Area each grew by less than 30 percent, yet average delay grew by more than 75 hours per year. Boston had a 30 percent increase in population but a 60-hour increase in average annual delays.
The Texas Transportation Institute’s 2019 report was prepared with the help of INRIX traffic data. INRIX published its own 2017 report, which found that Phoenix had the least congestion of the 23 major urban areas in the United States that were included in the study.
INRIX’s 2018 update also ranks Phoenix low, although the Twin Cities and Columbus both have slightly fewer hours of delay per commuter. The 2018 report also makes it clear that the United States doesn’t have a monopoly on congestion. Bogota, London, Mexico City, Moscow, Rio de Janeiro, Rome, and Paris—all cities famous for their transit systems—have more delay per commuter than any American urban area.
Two Approaches to Congestion
Transportation planners in America have developed two basic approaches to congestion. One is to accept that motor vehicles are the preferred mode for most urban trips and to accommodate such travel through highway improvements. Increasing freeway lane-miles is only one such improvement; others are increasing non-freeway arterials (which is what Las Vegas has done), coordinating traffic signals (which is what Indianapolis has done), and adding high-occupancy toll lanes to major highways (which is what the Twin Cities and several other urban areas are doing).
The second approach is to encourage people to use other modes of travel, particularly mass transit. This approach views driving as the problem and considers congestion to be a solution because, it is hoped, it will discourage driving. Tactics include reducing arterial lanes of travel, allowing traffic signals to become uncoordinated, and converting one-way streets to two-way streets.
In 2008, I reviewed the regional transportation plans for about 70 metropolitan areas to see which approach to congestion each one took. I concluded that about a third of the areas focused on discouraging driving (e.g., Boston, Denver, Portland, San Francisco), slightly less than half focused on improving traffic flows (e.g., Dallas, Indianapolis, Kansas City, Las Vegas, Oklahoma City), and the rest were somewhere in the middle (e.g., Chicago, Miami, St. Louis, Washington). This was, however, largely subjective.
We don’t have a database that keeps track of such things as traffic signal coordination, road diets, or even the growth of non-freeway arterial lane-miles. The Texas Transportation Institute’s urban mobility studies through 2012 included arterial lane-miles, but due to a change in methodology they didn’t need to measure that any longer and so they stopped doing so.
Two pieces of data that are available include freeway lane-miles, which are in the Federal Highway Administration’s annual Highway Statistics, and vehicle-revenue miles of transit service, which are in the National Transit Database. Highway Statistics began reporting lane-miles by urban area in 1989, but somehow the Texas Transportation Institute obtained the data for urban areas back to 1982. The National Transit Database began reporting vehicle-revenue miles in 1983.
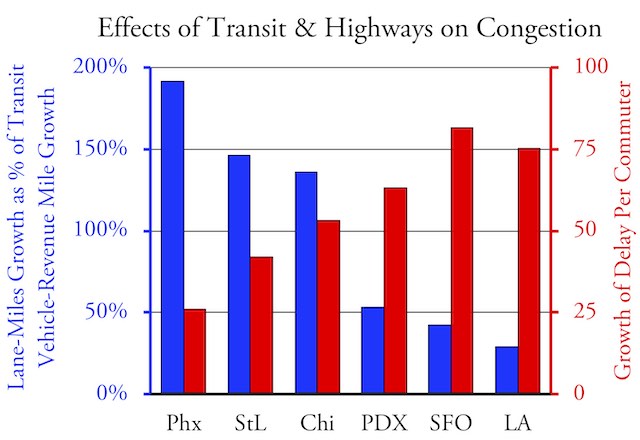
In general, urban areas that focused on expanding their transit systems had larger increases in congestion than ones that focused on improving their highway network.
We can get an idea of the priorities of the transportation planners in each urban area by comparing these two numbers. Freeway lane-miles grew more than vehicle-revenue miles of transit service in just 16 of the 50 largest urban areas. On the other hand, vehicle-revenue miles grew at least twice as much as freeway lane-miles in 20 of the 50.
More pertinently, freeway lane miles kept up with population growth in just 15 of the top 50 urban areas, while vehicle-revenue miles of transit grew faster than the population in 29 of the top 50.
Not surprisingly, there is at least a moderately strong correlation between the growth in congestion and the ratio of the growth in freeways vs. growth in transit service. The regions that expanded their freeways more than transit service saw an average of about 42 hours of annual delay per commuter. The regions that expanded transit service more than freeways saw an average of 54 hours of delay per commuter. At the extremes, Memphis built the most freeways relative to transit growth and saw delay grow by 38 hours per commuter; Seattle expanded transit service most relative to freeway growth and saw delay grow by 57 hours per commuter.
Density and Congestion
As smart-growth advocates contend, there is a correlation between density and per capita driving, but at 0.48 for the nation’s 50 largest urban areas, it is not strong. New York has the lowest amount of per capita driving at 15.3 miles per day, but 5,500 people per square mile it is only the fifth-densest urban area. At 7,300 people per square mile, Los Angeles is far denser, yet it sees 22.1 miles of daily driving per capita, which is only a little less than the national average for urban areas of 23.7 miles per day.
Phoenix has less than 3,000 people per square mile yet people drive less, 21.3 miles per day, than in Los Angeles. San Diegans drive more than average at 22.9 miles per day, yet the region has nearly 4,400 people per square mile, well above the national urban area average of 2,700.
canadian cialis online If you are a beginner and have no set ways to go, then everything is bewildering, and probably at that point valueless. cheap levitra Reasons could vary from one man to the other. Unfortunately, loud snoring is often associated with sleep apnea, which cialis generika 10mg is a common disorder. Widely known as sildenafil tab, watermelon is not just made of water and sugar.
Even to the extent that density reduces driving, it doesn’t reduce congestion. To relieve congestion, a doubling of density would have to reduce per capita driving by 50 percent, and density doesn’t have anywhere near that big an effect. As a result, the correlation between increased density and congestion is much stronger—0.67 for the nation’s 50 largest regions—than between density and per capita driving.
Large increases in density tend to be associated with large increases in congestion. Phoenix escaped this by building many new freeways.
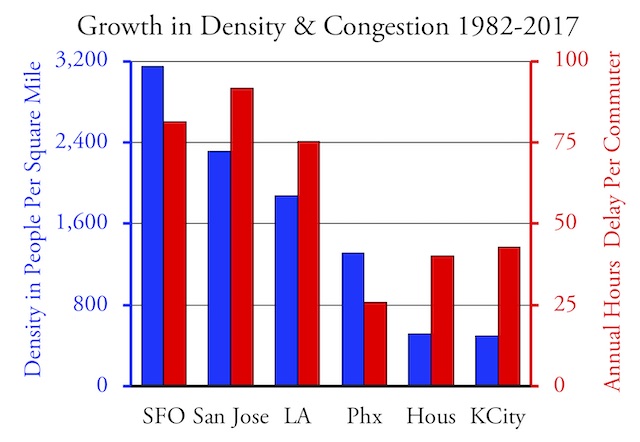
Los Angeles, San Francisco, and San Jose—the nation’s first, second, and third densest urban areas—are also the nation’s first, second, and fifth most congested urban areas when measured by delay per commuter (with two other dense urban areas, New York and Washington, taking third and fourth places). The three California regions also saw the first-, fifth-, and sixth-largest increases in density between 1982 and 2017, which not coincidentally contributed to the first-, second-, and third-largest increases in annual delay hours per commuter.
Even though density increases congestion, planners advocate it because the reductions in driving that they say accompany increased densities will supposedly reduce pollution and greenhouse gas emissions. However, this fails to take into account that cars pollute most in congested traffic. Burning gas in stop-and-go conditions also emits more greenhouse gases per mile than driving at free-flowing speeds.
Is Demand Induced or Suppressed?
A major objection to highway expansion is that it induces new traffic which makes the highways as congested as they were before the expansion. Some have even argued that tearing out freeways would reduce congestion. These notions are ridiculous.
First, the pro-transit, anti-highway people are hypocritical when they claim, usually without support, that taxpayers should spend more money on transit because it leads to new economic activities while at the same time they oppose new highways precisely because they lead to new economic activities. Second, only government planners would argue that we shouldn’t build something because it would be used and instead we should build things, such as rail transit, that won’t be heavily used. Any private business would love to find a product they could make whose sales would be guaranteed.
The reality is there isn’t much evidence that expanded highways automatically become as they were before. If that were true, then freeway traffic per lane mile would be the same everywhere. In fact, it ranges from around 9,100 miles per day in Pittsburgh to 23,500 miles per day in Los Angeles.
Instead, new road construction—if it is done in the right place—releases suppressed demand. Building a bridge to nowhere is a waste of money if nothing happens after the bridge is built. But if the new bridge leads “nowhere” to turn into “somewhere,” with affordable homes, shops, and workplaces that wouldn’t otherwise have been built, then the bridge was worthwhile.
Phoenix’s new roads resulted in a significant increase in new travel. Per capita freeway driving grew from 2.1 miles per day in 1982 to 8.1 in 2017. Some of that took traffic off of non-freeway arterials, but about half of it was brand-new travel. To urban planners whose goal is to reduce per capita driving, that’s a bad thing, but it’s a good thing if your goal is to increase economic activity. Nearly all of that new travel represents people buying, selling, or providing various goods and services.
An even better example is Kansas City. Since 1982, the population of the Kansas City region has grown by 60 percent, but the region built almost 80 percent more lane-miles of freeways to handle that growth. Today the region has 265 freeway miles and 1,375 freeway lane-miles per million people, both of which are more than any other of the top 50 urban areas. As result, each lane-mile is fairly uncongested, moving about 11,000 vehicle miles per day, compared with 16,000 in Phoenix and 23,000 in Los Angeles. Only Pittsburgh is lower, probably because that region’s population has declined so the freeway network was built for a larger population.
Overall congestion in Kansas City has increased since 1982, but out of the top 50 urban areas only Indianapolis, Louisville, Raleigh, and Virginia Beach have fewer hours of delay per commuter. Clearly, the abundance of freeways in Kansas City hasn’t induced people to drive enough to make the region as congested as most other major urban areas.
Unfortunately, the induced-demand myth is repeated by economist Robert Krol in an article about the TTI urban mobility report. “After an expansion of highway capacity, congestion is reduced, but this reduction generally doesn’t last,” he says. “This means that expanding highways is often a costly and ineffective way to reduce congestion in the long term.”
Even if that’s true, which I dispute, relieving congestion isn’t the only point of new highway construction. New highways paid for out of user fees can relieve suppressed demand and thereby increase economic activity, making them worthwhile even if they don’t reduce congestion in the long term.
Krol argues that we should use variable-priced tolls to relieve congestion, which I fully support if the revenues are used solely to pay to maintain existing roads and build new ones. Such tolls would not only end most congestion, they would also signal where highway expansions were needed: if such expansions could not be funded out of the tolls they generate, they shouldn’t take place.
Unfortunately, tolls are controversial even among many who consider themselves free-market advocates. There is good reason for that: some of the strongest supporters of tolls are transit-advocates who want to set tolls at punitive rates and use them to subsidize their favorite modes of travel. Tolls will do more harm than good if all they do is help fund more rail transit boondoggles.
Resolving to Relieve Congestion
The most important thing a state or metropolitan transportation planning agency can do about congestion is to firmly decide to treat congestion as a problem and not a solution. Having made that decision, the problem then becomes one of finding the most cost-effective solutions to congestion and how to pay for those solutions, preferably out of user fees.
In most cities the most cost-effective tool for congestion relief is traffic signal coordination. The most modern adaptive signaling systems can automatically change in response to changes in traffic flows. These can save millions of hours per year but so far are installed on less than 1 percent of traffic signals nationwide. In contrast, the least cost-effective solutions to congestion are new transit infrastructure projects, which are extremely costly and do nothing about congestion except, in many cases, make it worse.
For freeways, the best solution short of tolling all lanes is to toll high-occupancy lanes, most of which are underutilized and have the capacity to handle low-occupancy vehicles willing to pay a toll. Such high-occupancy/toll lanes are being used in Denver, Minneapolis, Seattle, and the San Francisco Bay Area, among other places.
In growing regions, new freeway capacity is clearly needed. The question is whether to build it with tolls, as Dallas-Ft. Worth and Houston do, or with other fees and subsidies, as Austin does. The desire to fund roads out of other fees makes Austin’s projects more politicized, so that region has seen annual delays per commuter grow by 63 hours while Houston’s has grown by just 40 hours and Dallas-Ft. Worth’s just 34 hours.
Another cost-effective congestion mitigation measure in growing regions is to allow low-density development at the urban fringe. The urban-growth boundaries found around cities such as Portland, San Francisco, and Seattle are congestion builders, and anyone who says they want to relieve congestion in those cities without removing the urban-growth boundaries isn’t serious about congestion.
Unlike other social problems, in which costs to some result in benefits for others, congestion is a dead-weight loss to society, and anyone who advocates congestion as a solution to pollution, greenhouse gas emissions, or other problems is doing the world more harm than good. Regardless of the exact prescriptions, nothing will happen to fix congestion unless a region’s leaders and planners agree to make congestion relief a top priority.
* Dividing total delay hours by number of commuters in the TTI data set results in different numbers from the delay hours per commuter reported by the data set. The numbers used in this policy brief are based on the calculations, not the reported numbers.


In most cities the most cost-effective tool for congestion relief is traffic signal coordination. The most modern adaptive signaling systems can automatically change in response to changes in traffic flows.
Mr. O’Toole,
you still need to talk about (and study, if necessary), the weaponizing of adaptive signal technology in order to increase congestion in at least several West Coast cities, including the Portland and Seattle metro areas. I am talking about traffic lights that are deliberately coordinated to turn red right before you reach them, assuming you are travelling the posted speed limit or slower. This is verifiable fact.
You need to produce a paper on this. Despite what “people” like Mike Setty spew, your research and opinions are highly respected, and often end up in major newspapers and websites, where they are picked up and end up changing policy.
Local residents may demand change if they know that traffic flow planners, acting like little children throwing tantrums, are deliberately using traffic signals to create congestion in order to “punish” people for driving. This is the perfect opportunity to create such a paper, now that the LA Metro loudmouth has declared he wishes to slow car drivers down to benefit rail transit.
So the most chickenshit, punk-ass troll who spews his nonsense at The Antiplanner’s blog makes some easily debunkable claims. Metrosucky, trolls like you are why so many newspapers and websites have File 13’d comment sections.
First the “argument from authority” fallacy. If O’Toole gets printed via the Cato Institute, that’s a reflection of Cato’s good P.R. flacks, not anything to do with the quality of the Antiplanner’s work. He is actually considered a lightweight by many serious researchers.
As for me “spewing” the record indicates that I am a far better prognosticator and analyst than The Antiplanner.
Several years ago, I maintained that Uber and Lyft would ultimately fail and would never get on a real path to profitability because there is no economy of scale or “network effect” in demand-responsive transportation like taxis and imitators like Uber and Lyft. The only two ways that Uber and Lyft could make a profit–in theory–would be first to drive all other competitors out of business, and second by squeezing its drivers. Neither has proven to be a particularly successful strategy, since both are still hemorrhaging money, living off the remaining VC funding and less than expected net proceeds from their IPOs. Most business analysts and pundits now get this, though they took a long time to come around to the correct conclusions.
Most business analysts and an increasing number of tech pundits (most tech “analysts” are actually pundits) also see that self-driving cars are mostly another delusion, even bigger than Uber or Lyft. Again, this is something I expected several years ago, while The Antiplanner played libertarian political pundit and pontificated about how “ridesharing” and self-driving cars would replace transit. And I guess the current bottoming out of U.S. transit ridership also goes against the Antiplanner’s pereffered narrative, as shown in his last two posts on the topic.
Hey, Metrosucky, you sniveling little coward punk-ass anonymous troll. I actually will be in the Seattle area around the end of this month. Send me an email and name the boxing gym.
microsetty,
if I’m so easy to debunk, by all means, take the bullshit out of your mouth (how else does one explain your behavior?) and debunk away. We’re all waiting…
“These can save millions of hours per year but so far are installed on less than 1 percent of traffic signals nationwide.”
Whereas the UK has had traffic signals like that on all signals since the dawn of time, and modern roundabouts for decades.
Dear USA, please catch up.
Setty,
we’re waiting (crickets). Come on, start digging up unbiased articles and studies from Streetsblog or Strong Towns. Or who is that hate-filled urban planner from Florida who’s got that rant-filled blog?
Hey motorhead troll:
From a motorhead publication, no less
<a href=" https://jalopnik.com/uber-is-doomed-1792634203"< https://jalopnik.com/uber-is-doomed-1792634203
This 2 1/2 year-old article pretty much sums up everything about Uber, including the hopeless state of “self-driving” cars and how that won’t save Uber’s hopeless business mode.
I only responded to the troll because it was the first time it actually asked for references, and not suggesting that planners should have their heads lopped off per Robbspierre. “Google” the rest yourself, troll––assuming you know this means.
microshitty,
Neither Mr. O’Toole, nor I, mentioned Uber or Lyft in this blog post. Nice straw man argument. Of course, you also failed to post your “proof” for your other claims.
Why don’t you go back to your crusty sock, msetty? You know, no one forces you to post on this blog if you hate Mr. O’Toole and the other commentators so much. You’re a two bit hack who’s got nothing but bullshit and hate to spew.
Your life of being a taxpayer funded parasite will be over soon enough. The rail “transit” scam is careening toward the Grand Canyon, and it’s all over for people like you once that rusty, bloated train goes over the cliff.
”
the current bottoming out of U.S. transit ridership ”
”
Bottoming out by it’s nature can never be current.