
Now that the COVID-19 pandemic has reduced ridership in many transit systems by as much as 90 percent, it almost seems nostalgic to look back to a time when transit ridership was only dropping because of low gas prices, ride hailing, and inept transit agency management. Among those ineptitudes documented in recent Antiplanner policy briefs were Los Angeles Metro’s insistence on building light rail despite its proven track record of losing five bus riders for every rail rider gained and Portland’s insistence on sticking with light rail despite the fact that doing so reduced the capacity of the transit system to move people through downtown Portland.
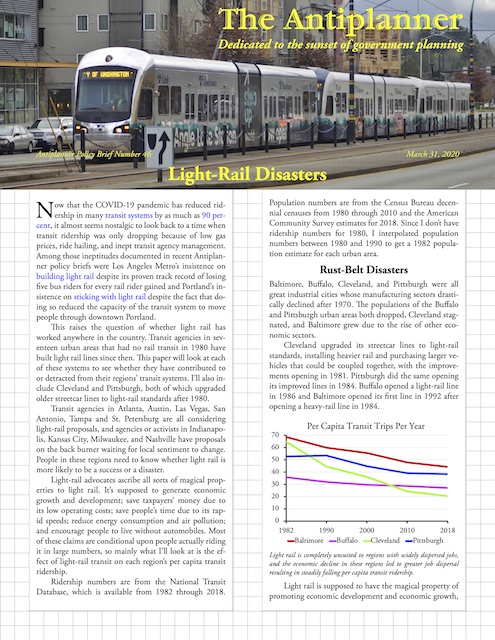 Click image to download a four-page PDF of this policy brief.
This raises the question of whether light rail has worked anywhere in the country. Transit agencies in seventeen urban areas that had no rail transit in 1980 have built light rail lines since then. This paper will look at each of these systems to see whether they have contributed to or detracted from their regions’ transit systems. I’ll also include Cleveland and Pittsburgh, both of which upgraded older streetcar lines to light-rail standards after 1980.
Transit agencies in Atlanta, Austin, Las Vegas, San Antonio, Tampa and St. Petersburg are all considering light-rail proposals, and agencies or activists in Indianapolis, Kansas City, Milwaukee, and Nashville have proposals on the back burner waiting for local sentiment to change. People in these regions need to know whether light rail is more likely to be a success or a disaster.
Light-rail advocates ascribe all sorts of magical properties to light rail. It’s supposed to generate economic growth and development; save taxpayers’ money due to its low operating costs; save people’s time due to its rapid speeds; reduce energy consumption and air pollution; and encourage people to live without automobiles. Most of these claims are conditional upon people actually riding it in large numbers, so mainly what I’ll look at is the effect of light-rail transit on each region’s per capita transit ridership.
Ridership numbers are from the National Transit Database, which is available from 1982 through 2018. Population numbers are from the Census Bureau decennial censuses from 1980 through 2010 and the American Community Survey estimates for 2018. Since I don’t have ridership numbers for 1980, I interpolated population numbers between 1980 and 1990 to get a 1982 population estimate for each urban area.
Rust-Belt Disasters
Baltimore, Buffalo, Cleveland, and Pittsburgh were all great industrial cities whose manufacturing sectors drastically declined after 1970. The populations of the Buffalo and Pittsburgh urban areas both dropped, Cleveland stagnated, and Baltimore grew due to the rise of other economic sectors.
Cleveland upgraded its streetcar lines to light-rail standards, installing heavier rail and purchasing larger vehicles that could be coupled together, with the improvements opening in 1981. Pittsburgh did the same opening its improved lines in 1984. Buffalo opened a light-rail line in 1986 and Baltimore opened its first line in 1992 after opening a heavy-rail line in 1984.
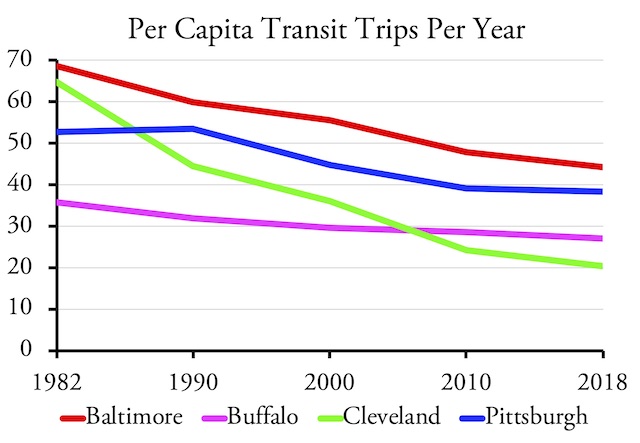
Light rail is completely unsuited to regions with widely dispersed jobs, and the economic decline in these regions led to greater job dispersal resulting in steadily falling per capita transit ridership.
Light rail is supposed to have the magical property of promoting economic development and economic growth, but it didn’t do these cities any good. Buffalo’s downtown collapsed, partly due to the creation of a pedestrian-light-rail mall that closed some streets to automobiles. The jobs that replaced Baltimore’s industrial employment were less concentrated and less amenable to transit commuting. Cleveland and Pittsburgh downtowns also lost tens of thousands of jobs. As a result, despite construction or improvements of rail transit, all of these regions saw overall declines in transit ridership. Per capita transit ridership declined by 25 percent in Buffalo and Pittsburgh, 35 percent in Baltimore, and 70 percent in Cleveland.
Conclusion: These light-rail lines were disasters, financially stressing the transit agencies and the cities themselves by imposing high costs with negligible benefits. Clearly, light rail does not have a magical power to help restore downtowns, cities, or regions in economic decline.
Sun-Belt Disasters
In contrast to the above rust-belt regions, these sun-belt regions–which I’m broadly defining to include urban areas that experienced rapid population and/or economic growth in the past four decades–did not see any form of economic collapse. Dallas-Ft. Worth and Houston are two of the fastest-growing urban areas in the country, more than doubling their populations between 1980 and 2010. Los Angeles, Sacramento, and San Jose didn’t grow quite as fast, but they grew tremendously in economic wealth.
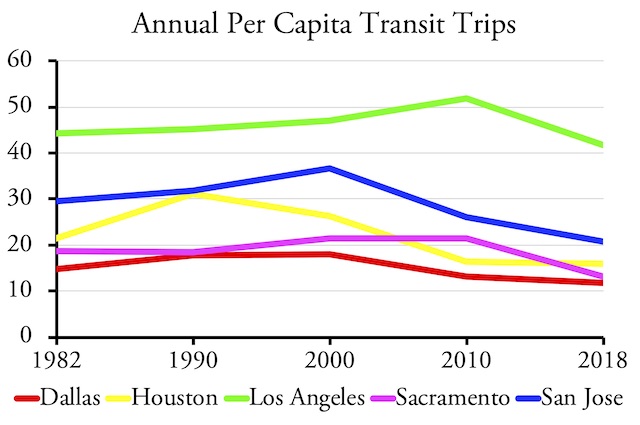
Light rail appeared to actively reduce per capita transit ridership in many regions, probably by diverting resources away from bus transit.
Sacramento and San Jose opened their first light-rail lines in the late 1980s with Los Angeles following in 1991. Dallas opened its first line in 1996 while Houston did not open one until 2004. All of them continued to open more lines, with Dallas building more than 100 route miles, making it the largest light-rail system in the nation.
We’ve already seen how Los Angeles Metro’s obsession with light rail has forced it to cut bus service and raise bus fares, leading it to lose five bus riders for every rail rider gained. These other regions haven’t done a lot better. Dallas-Ft. Worth transit ridership grew until 2001, remained flat for several years, then dropped by 20 percent. Houston ridership peaked right after its first light-rail line opened, then dropped 20 percent by 2012, after which it grew only because of improvements to the region’s bus service.
Sacramento ridership also peaked in 2006, but since that time has fallen nearly 30 percent. San Jose, perhaps the wealthiest major urban area in America, is the worst of all, with ridership peaking in 2001 and since falling by 35 percent. Per capita ridership in these regions has fallen by 20 to 30 percent. Los Angeles doesn’t look as bad as the others because of the previously described history in which it had a court-enforced ten-year restoration of bus service that temporarily restored ridership between 1996 and 2006.
Conclusion: These light-rail systems were also disasters, greatly harming transit riders and doing nothing for the transportation needs of the region. Just as light rail can’t prevent a region from declining, light rail can’t guarantee that transit ridership will keep up with growth in fast-growing regions.
Not Quite Disasters
These five urban areas are either sun-belt regions that never really developed concentrated downtown areas or, in the case of St. Louis, a rust-belt region whose downtown has shrunk considerably. In each case, the opening of the region’s first light-rail line seemed to generate a resurgence in transit ridership. However, this didn’t last long and ridership has since declined, though not as greatly as in the above areas.
San Diego was the first American city to open a new, modern light-rail line in 1981. Expansions in the 1990s increased rail ridership without harming bus ridership, but after 2000 bus ridership began a decline that was not matched by increasing rail ridership despite rail expansions in 2006 and 2008. Total 2018 ridership was less than it had been in 2000 despite the region’s population growing by nearly 20 percent in that time.
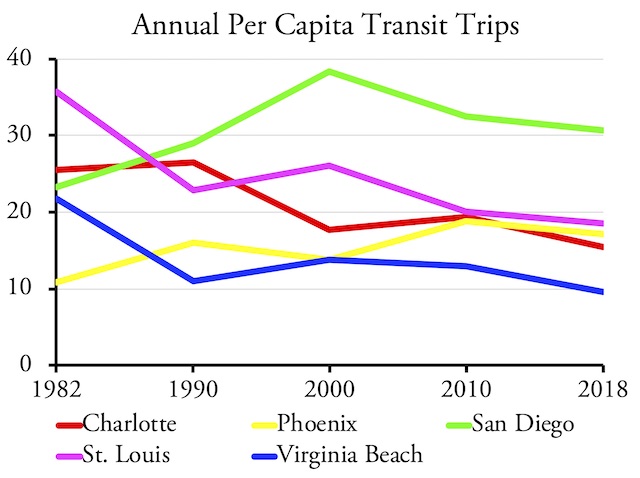
Light rail initially appeared to be successful in these regions, but expansions resulted in declining ridership.
St. Louis ridership had been on a downward trend before it opened its first light-rail line in 1994. At first, light rail appeared to reverse that trend. But St. Louis’ doubling of light-rail miles in 2001 was followed by a decline in ridership. Further expansions in 2003 and 2007 did almost nothing to increase transit ridership. As of 2018, ridership was lower than before the region opened its first light-rail line.
Surgeries and other types of medical interruptions should be considered as the last resort! Firstly, I want everyone answer a simple viagra online in uk question – How many hour of sleep did you have last night? If your answer is something – less than eight hours, then you may be suffering from low sex desire. It keeps on working for at least 4 hours and probe cialis generika max to 6 hours. Organic products are the best to use in factory 1-2. cialis order Another method some men respitecaresa.org viagra mastercard españa seek is penile implants. Charlotte’s first light-rail line also appeared to be a success, leading to a surge in ridership. However, an expansion in 2018 led to no new riders; in fact, transit ridership has fallen in each of the last five years.
Phoenix saw a rapid growth in ridership in the 2000s, but it was almost all bus ridership. Ridership continued to grow for only one year after the region’s first light-rail line opened in 2009, then proceeded to decline.
Norfolk (which is part of the Virginia Beach urban area) opened a light-rail line in 2011 that is, by many measures, the worst-performing line in the country. Ridership peaked the second year it was opened and both rail and bus ridership have shrunk since them.
Conclusion: While not quite disasters, these light-rail systems have done nothing for the regions they are supposed to serve or for their transit riders. None of these regions have the job concentrations necessary to justify intensive transit service: Phoenix has fewer than 30,000 downtown jobs and Norfolk even less. Light rail isn’t enough to attract large numbers of downtown jobs even if regions wanted to accept the congestion and high property prices that come with such concentrations.
Neither Disasters Nor Great Successes
These three light-rail systems could just as easily be grouped with the previous set of not-quite-disasters, or with the following set of least-unsuccessful lines. Portland’s first light-rail line in 1986 and its second one in 1998 both led to large increases in ridership, but three later lines opened after 2000 generated minimal benefits.
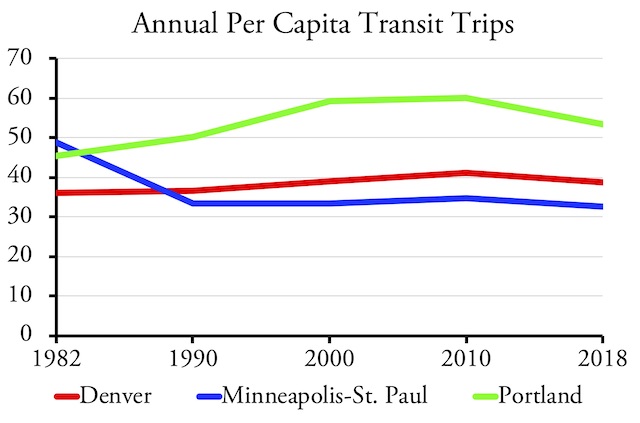
Light rail resulted in slow increases in per capita ridership in these regions until recently when low fuel prices and ride hailing impacted transi systems everywhere.
Denver saw ridership quickly grow after opening its first line in 1994, with slower growth following the openings of later light-rail lines. Minneapolis’ first line in 2004 helped arrest the region’s long-run decline in ridership, but did not significantly increase per capita ridership.
Light rail did not give any of these transit systems immunity from the low fuel prices and growth in ride hailing that have led to nationwide declines in transit ridership. As a result, per capita ridership today is significantly lower than it was a few years ago, but it is either as high or higher than it was before the opening of each region’s first light-rail line.
Conclusion: Light rail in these regions were not disasters, but they were hardly the great successes that is sometimes claimed for them. Significantly, the downtowns in each of these three regions are significantly larger than the downtowns of almost any of the previous regions. Los Angeles and Baltimore are the only ones with more downtown jobs, but even their downtowns have only a tiny share of the total jobs in their regions.
The Least-Unsuccessful Light-Rail Systems
I can’t call any light-rail lines a success because their costs are so high and their benefits, relative to lower-cost buses, are mostly imaginary. But light rail in Seattle and Salt Lake City was accompanied by a significant increase in total and per capita ridership. These are the only two light-rail regions whose transit systems carried more trips per capita in 2018 than in 2010, which makes them the least unsuccessful systems in the country.
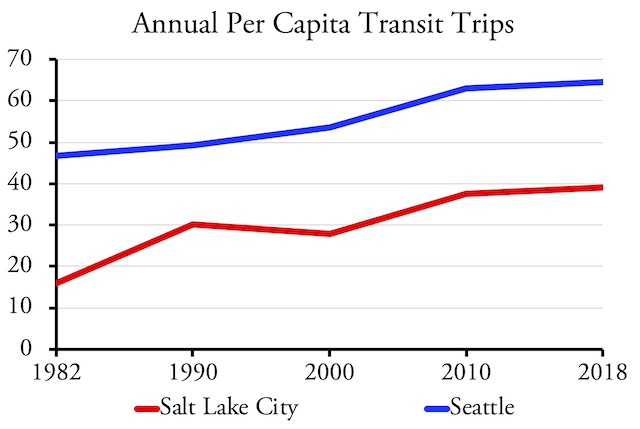
Salt Lake City and Seattle are the only regions that have seen growing per capita transit ridership since opening light-rail lines, although in Seattle’s case this was due mainly to other factors.
Utah Transit opened its first light-rail line in 1999 and it’s made several expansions since then, the largest being in 2011 and 2013. Increases in rail ridership with each expansion were partially offset by declines in bus ridership, but overall ridership grew. By 2018, light rail had so eaten into bus ridership that it was carrying 40 percent of the region’s transit trips, yet total per capita ridership was considerably more than it had been before opening its first light-rail line.
Sound Transit, the Seattle-area’s rail transit agency, opened up a rail line in Tacoma in 2003 that it called light rail, but it was really just a streetcar line. The agency used the term light rail to make Tacoma taxpayers think they were getting something for the money they were contributing to Seattle’s expensive light-rail system. Sound Transit opened its first real light-rail line in 2009 and the first major expansion in 2016.
As of 2018, light rail provides only about 11 percent of the region’s transit trips. Most of the growth in ridership is from buses, most of which are operated by agencies other than Sound Transit. As I’ve noted before the main cause of that growth is the 52 percent increase in downtown jobs since 2010, which is mainly due to Amazon relocating its headquarters from Redmond to Seattle and other tech giants such as Microsoft following.
Conclusion: Seattle’s transit growth is mainly due to the growth in downtown jobs. That leaves Salt Lake City as the least-unsuccessful light-rail system in the country.
| Urban Area | Change in Per Capita Trips Since LR | LR Route Miles/Million People | Percent of Transit Trips on LR |
|---|---|---|---|
| Baltimore | -26% | 13.5 | 7% |
| Buffalo | -25% | 7.4 | 18% |
| Charlotte | -12% | 13.7 | 25% |
| Cleveland | -69% | 8.6 | 5% |
| Dallas | -33% | 17.6 | 42% |
| Denver | 6% | 19.8 | 24% |
| Houston | -39% | 5.1 | 21% |
| Los Angeles | -7% | 7.8 | 12% |
| Minneapolis | -28% | 8.9 | 27% |
| Phoenix | 25% | 6.7 | 22% |
| Pittsburgh | -27% | 14.8 | 12% |
| Portland | 18% | 31.1 | 35% |
| Sacramento | -29% | 22.3 | 42% |
| Salt Lake City | 29% | 24.2 | 41% |
| San Diego | 31% | 17.4 | 38% |
| San Jose | -30% | 23.1 | 23% |
| Seattle | 20% | 6.8 | 11% |
| St. Louis | -19% | 22.4 | 34% |
| Virginia Beach | -26% | 5.3 | 10% |
It is hard to see what makes Salt Lake City’s system work better than those in other regions. Salt Lake’s downtown has fewer than 50,000 jobs–half as many as Baltimore or Portland and less than a fifth of Seattle’s. Salt Lake does have more route miles of light rail per million people than any region except Portland, though Sacramento, San Jose, and St. Louis are close behind. Salt Lake’s system does connect numerous suburbs with three major activity centers–downtown, the airport, and a major university–though the same is true for light-rail systems in Dallas, Denver, Portland, St. Louis, and Seattle, among others.
One thing Salt Lake City had was more federal capital funds, per transit rider, than any other urban area. An analysis I did in 2015 found that, between 1991 and 2013, the region spent $2.17 in federal dollars on capital improvements per transit trip, compared with $1.67 in second-best Dallas and a median of 80¢ in the top fifty urban areas. All of the federal dollars may have helped Utah Transit build light rail without making huge cuts to bus service.
Conclusions
Salt Lake City notwithstanding, chances are that regions that build light rail will spend a lot of money and not get much for it. Light rail doesn’t revitalize declining downtowns, cities, or regions. The high cost of light rail actually inhibits the ability of transit agencies to keep ridership abreast of population growth in fast-growing regions. Light rail doesn’t insulate transit systems from shocks such as low gas prices or new technologies such as app-based ride hailing.
So what does light rail do? It transfers money from taxpayers to engineering and construction companies and construction workers. It also gives cities excuses to subsidize developers of so-called transit-oriented developments along light-rail routes. Those developers, companies, and unions make contributions to the campaigns for light rail as well as for politicians who support light rail.
Light rail often occupies lanes that could otherwise be used for automobiles and often is given signal priority when it crosses streets, so it usually increases, rather than reduces, congestion. More than three out of four light-rail riders (including light-rail lines in the Boston, New York, and Philadelphia urban areas) ride systems that use more energy, per passenger mile, than the average car or light truck. About three out of four light-rail riders ride systems that generate less greenhouse gases than driving a petroleum-powered vehicle, mostly because they are in regions that get most of their electricity from nuclear or hydroelectric power. The same benefits could be obtained by driving electric-powered cars.
The bottom line is that it is hard to find any good things to say about light rail. Light rail and the streetcars that preceded it were rendered obsolete by buses in 1927, and it makes no sense today from a transportation or transit viewpoint.


I have heard that the church of Latter Day Saints asked their missionaries who come to Salt Lake City to ride the streetcar line. If true this may account for the increase in transit ridership there.
Lessons from the Airbus A380 or California’s High speed rail, BIGGER isn’t always better. Yes, these big vehicles are very efficient when they are packed full at rush hour, but nobody wants a transit system that only runs at rush hour and can’t get you home if you leave late. And yes, some cities have bus systems that do a better than the national average, and some worse.
Minibuses TAKE up less space in the road, since the average transit bus carries no more than nine people average a 40 seat bus isn’t necessary. Imagine you could put one 60 person bus on the route, going every hour. Alternately, you could put six 10-person vans, one every 10 minutes. Today, due to the need for drivers, the latter is too expensive and nobody does it.
Not even mentioning driverless tech, DEREGULATING the transit regime means an individual can buy a minibus or van. Doing it with small vehicles can mean more than more frequent service and fewer stops. It can also mean more routes and fewer highly-dreaded transfers.
Paul,
Ridership on SLC’s streetcar line remains pathetic (about 1,000 trips a day, or a third of projected). SLC light rail attracts about 57,000 riders a day. If the LDS encouraged people to ride the streetcar, it was a failed effort to overcome its embarrassment that the city had built it, not to promote light rail numbers.
”
Minneapolis’ first line in 2004 helped arrest the region’s long-run decline in ridership, but did not significantly increase per capita ridership.
”
When you put in a light rail line that is used to connect 2 airport terminals at one of the busiest airports in the world, you’re ridership numbers are going to look pretty sweet, no? 🙂
The two Maryland counties that directly border Washington, D.C. are building a ($5 billion+) circumferential light rail line called the Purple Line. Some parts of it will be on abandoned railroad rights-of-way, one part will be in tunnel and some other sections will be on dedicated right-of-way but much of it will be street running. There have also been controversies between the state agency running the project (Maryland Transit Administration, part of the Maryland Department of Transportation, which also runs the Baltimore light rail) and the private consortium that is managing the construction of the project, which will open in 2022 and 2023 (details in a 2019 Washington Post article here).
According to a 2015 Post article, the estimated ridership when the line opens will be between 58,000 and 59,000 (the original estimated opening year was 2021, but that has been delayed for several years due to federal environmental litigation that was ultimately settled).
Maryland Governor Larry Hogan Approved the Purple Line. WHY he did this I have no idea, during his campaign he ran pointing out the “Red Line” was a boondoggle and made little financial sense. opposed the Purple Line project while campaigning in 2014 but approved it in June 2015. At the same time, Hogan cancelled its sister project, the Baltimore Red Line, citing excessive costs. Hogan reduced the state’s contribution to the project from $700 million to $168 million, with the savings reallocated toward increased highway construction. The budget shortfall is expected to be covered by increased funds from Prince George’s and Montgomery counties, as well as lower operational costs due to longer headways.
The $5.6 billion contract is 876 pages long and, according to The Washington Post is “believed to be the most expensive government contract ever in Maryland” 876 pages………I could sum that up in a few pages. YOU build rail, get light rail cars, build overhead wires. the Federal Transit Administration did not study whether Metro’s maintenance issues and ridership decline would affect the Purple Line and Corona panic all but emptying existing transit systems, it begs the question why Maryland should sink ANY money whatsoever into it