A Realistic Transit Game

Here’s a fun new game you can buy. It’s called Transform Transit and the goal of the game is to complete new transit projects such as building new stations or replacing the vehicle fleet. While attempting to manage projects, players have to keep employee morale up and get stooges transit bloggers to write glowing reviews of the projects.

One thing that is missing is actually getting people to ride transit, but that’s perfectly realistic as that no longer seems to be a goal of transit agencies. Related to that is increasing fare revenues, but again that’s no longer a goal of transit agencies. Instead, the goal is to keep politicians and political allies happy so the transit agency can get a continuous stream of subsidies to fund more projects. Continue reading

Pandemic Increases Homeownership, Single-Family

The share of homes owned by their occupants grew from 64.1 percent in 2019 to 65.2 percent in 2022, according to data from the American Community Survey. The share of homes that were single-family increased slightly from 68.6 percent to 68.6 percent.

The share of people living in owner-occupied homes grew from 66.4 percent in 2019 to 68.4 percent in 2022, while the share of people living in single-family homes grew from 73.6 percent in 2019 to 74.2 percent in 2022. Continue reading

Where Housing Is Still Affordable

The median home value of homes in the United States was $320,900 in 2022 while the median family income was $92,148 according to the 2022 American Community Survey. This means that the median home cost less than 3.5 times median family income, which is pretty affordable. Even at today’s relatively high interest rates, someone getting a mortgage that is 3.5 times their income should be able to pay it off in well under 30 years while paying less than 30 percent of their income on the mortgage.

Value-to-income ratios ranged from well over 10 in Los Angeles and several other California cities to under 1.5 in Decatur Illinois and several Illinois counties. The states with the least affordable housing are Hawaii and California followed by Washington and Oregon — all states with urban-growth boundaries and other rural land-use restrictions. The most affordable states are Indiana, Ohio, Kansas, Iowa, West Virginia, and Mississippi. Continue reading

2022 ACS Transportation Data

About 5.0 million Americans relied on transit to get to work in 2022, according to American Community Survey data released by the Census Bureau last week. This is more than the 3.8 million people who took transit to work in 2021, but far less than the 7.8 million to used transit in 2019. People who used transit represented 3.1 percent of the workforce, up from 2.5 percent in 2021 but down from 5.0 percent in 2019.

There was about 6 percent more commuter traffic on the roads in 2022 than 2021, but still about 7 percent less than 2019. Photo by Tomi Knuutila.

Transit’s share is strongly skewed by New York City, which housed 2.5 percent of the nation’s workers but 34.6 percent of the nation’s transit commuters in 2022. Outside of New York City, only 2.1 percent of workers relied on transit to get to work in 2022. That’s just the city: the New York urban area had 45.4 percent of the nation’s transit commuters, and outside of that area only 1.8 percent of workers relied on transit. Continue reading

A Polycentric Plan for Portland

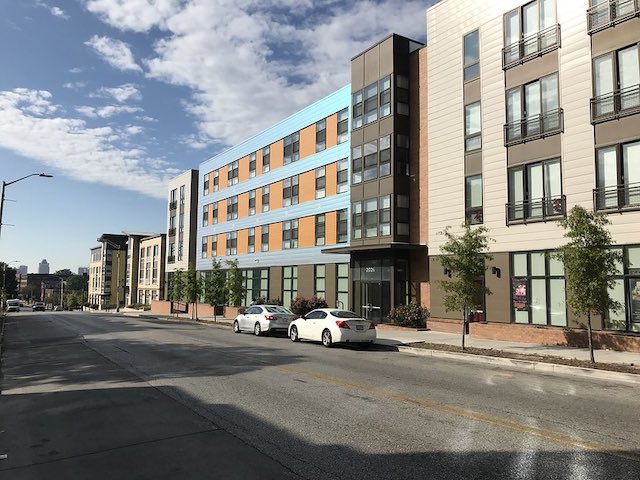
Portland’s TriMet transit agency is attempting to serve a 2020s urban area with a 1910 transit system, says a new report published by the Cascade Policy Institute. The agency’s infatuation with rail transit underscores this problem, as rail transit makes no sense for rapidly evolving regions with multiple economic centers. TriMet’s current route map works well only for downtown employees: while more than 40 percent of downtown workers took transit to work before the pandemic, less than 3.5 percent of workers in the rest of the urban area used transit.

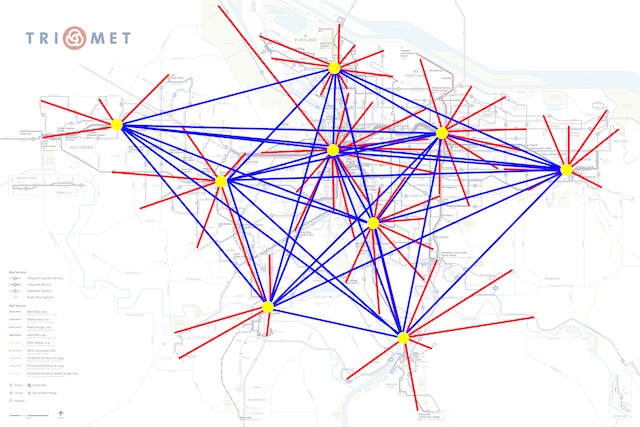
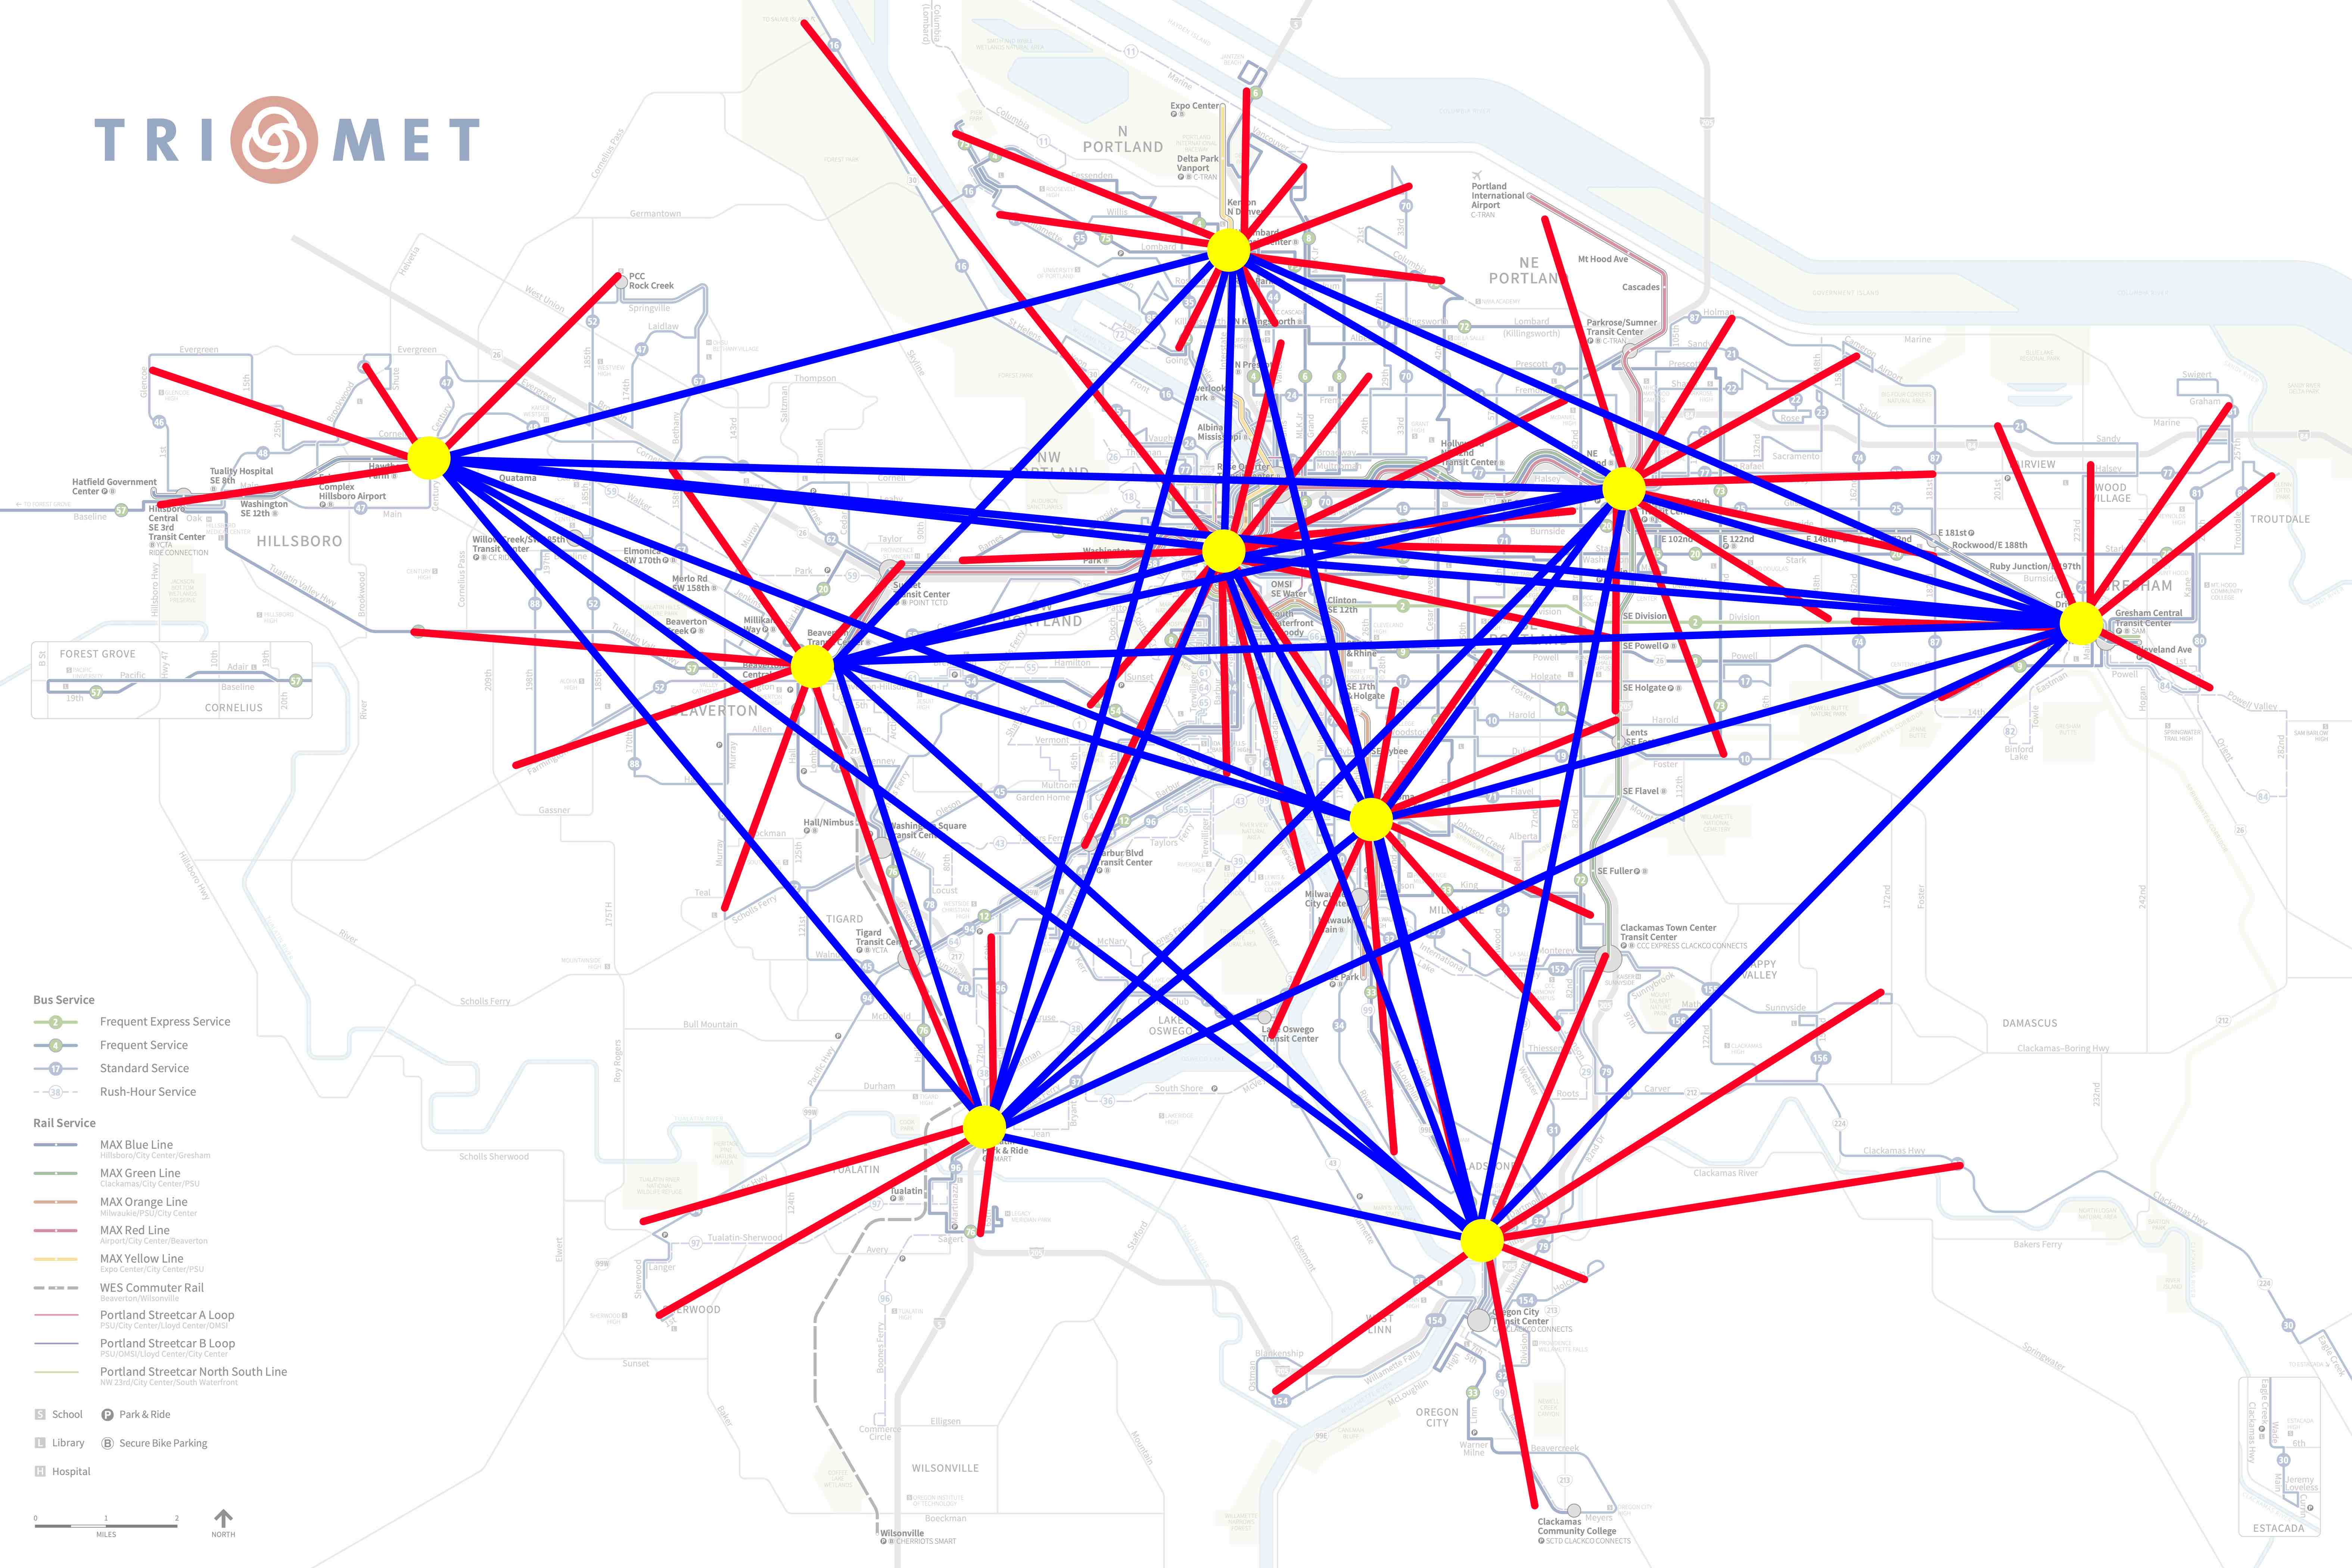
The Cascade Policy Institute report proposes to replace TriMet’s current bus route map with a hub-and-spoke system using nine hubs. Yellow circles are the hubs. Blue lines represent non-stop buses from every hub to every other hub. Red lines represent local buses radiating away from each hub. The lines are not exact routes and only show the origins and (in the case of the red lines) approximate destinations of each route. Click image for a larger view.

All of these problems were made worse by the pandemic, which hit rail transit especially hard and which greatly reduced the importance of downtown Portland as an economic center. According to the latest report, Portland’s downtown has the second-worst recovery of any of the nation’s 50 largest downtowns, with less than 40 percent the economic activity of the pre-pandemic period. Yet TriMet still wants to build two new light-rail lines to downtown even though the last line it opened gained no net new riders for the transit system. Continue reading

Transport and Economic Opportunity: 2020

The nation’s fifty largest urban areas housed 82.5 million jobs in 2020, and auto drivers could reach 98 percent of them in an hour of travel. Transit riders, by comparison, could reach only 8 percent in an hour while bicycle riders could reach 7 percent, according to the University of Minnesota Accessibility Observatory.

The average resident of one of the nation’s fifty largest urban areas can reach 600,000 jobs in a 30-minute auto trip but only 85,000 jobs in a 50-minute transit trip and 92,000 jobs in a 50-minute bike ride.

I’ve previously cited the observatory’s 2019 data many times, but when writing yesterday’s post about travel speeds and productivity, I noticed that it has recently updated the data to 2020. The introduction says the data were collected before the pandemic so “the 2020 results may provide a useful baseline for evaluating the impact that COVID-19 had on access across America.” Continue reading

Do Higher Speeds = Higher Incomes?

A new study published by the National Bureau of Economic Research (ungated copy) finds that, whaddyknow, faster urban speeds are associated with richer countries. The study looked at urban travel speeds in 1,200 cities around the world to “find that improved urban mobility is an important and previously undocumented feature of economic development.”

Important yes, but hardly previously undocumented, as researchers such as Rémy Prud’Homme in France and Sam Staley and Adrian Moore in the United States have looked at the relationship between travel speeds and economic productivity. That has also been a consistent theme of the Antiplanner, especially when comparing the ability of fast cars vs. slow transit to help people out of poverty. Continue reading

Biden’s Senior Rail Moment

All during the debate over the 2021 infrastructure bill, President Biden kept talking about how much the country would benefit from high-speed rail even though there was no high-speed rail in his own version of the bill. He seems to be having another senior moment with his proposal to build a railroad from India to Europe via Saudi Arabia and United Arab Emirates.

The problem with this plan is there are 600 to 700 miles of Arabian Sea between India and United Arab Emirates. If you are shipping from India to Europe, once you transfer cargo from a train to a ship, you might as well run the ship all the way to Europe because it costs a lot less than transferring the cargo back to a train and running a train to Europe. Continue reading

July 2023 Transit Ridership 65% of July 2019

After reaching 70 percent of pre-pandemic numbers in June, transit ridership in July fell back to 65 percent of July 2019, according to data released last week by the Federal Transit Administration. Since July 2019 had 22 working days while July 2023 only had 20, this decline is not surprising.

Meanwhile, Americans drove 97.2 percent as many miles in July 2023 as in the same month of 2019, according to Federal Highway Administration data released last week as well. Amtrak’s monthly performance report indicates that the railroad carried 91.2 percent as many passenger-miles in July 2023 as July 2019, while the Transportation Security Administration says that 98.8 percent as many travelers passed through security in July as in 2019. Continue reading

Thousands of NYC Rent-Controlled Apartments Sit Vacant

Here’s evidence, if anyone needs it, that rent control contributes to housing scarcity: a new report says that more than 13,000 rent-controlled apartments have been vacant for at least two years. Nearly 90,000 rent-controlled apartments were vacant in 2021 and more than 60,000 were still vacant in 2022.

Manhattan apartment building. Photo by David Merrett.

When people leave a New York City rent-controlled apartment, landlords are allowed to raise the rent for the next occupants by $89 a month. Too often, that’s not enough to pay for the repairs and other work needed to make the apartment attractive to new renters. As a result, the apartments sit vacant, waiting for the owners to sell or, less likely, for the rent control law to be repealed. Continue reading