July 2023 Transit Ridership 65% of July 2019

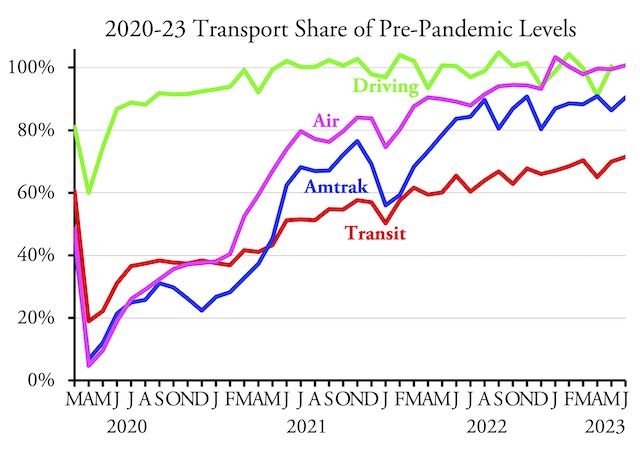
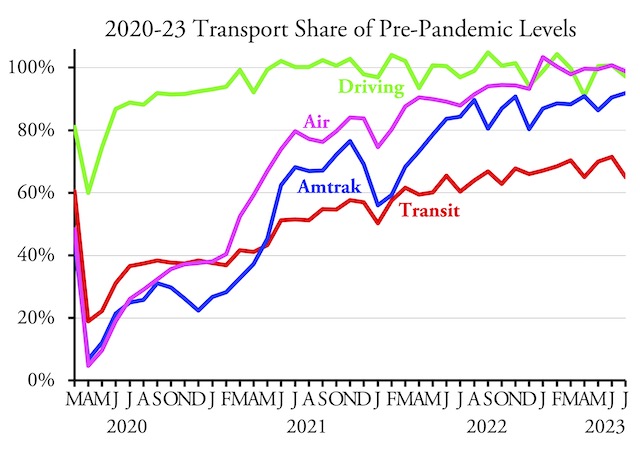
After reaching 70 percent of pre-pandemic numbers in June, transit ridership in July fell back to 65 percent of July 2019, according to data released last week by the Federal Transit Administration. Since July 2019 had 22 working days while July 2023 only had 20, this decline is not surprising.

Meanwhile, Americans drove 97.2 percent as many miles in July 2023 as in the same month of 2019, according to Federal Highway Administration data released last week as well. Amtrak’s monthly performance report indicates that the railroad carried 91.2 percent as many passenger-miles in July 2023 as July 2019, while the Transportation Security Administration says that 98.8 percent as many travelers passed through security in July as in 2019. Continue reading

How to Pay for Amtrak’s Deficits

Amtrak operations lost $1.2 billion last year without even counting depreciation and the other costs that Amtrak pretends aren’t real. (The $1.2 billion is calculated by adding $885 million “adjusted operating earnings” to the $329 million “state supported train revenue” that Amtrak pretends isn’t a subsidy.) A railroad in Japan provides an example of one way Amtrak could cover this deficit.

The Choshi Electric Railway hit some hard times in the 1990s, as did most Japanese businesses, due to the nation’s economic slump. The railway almost went out of business, but then it hit upon the idea of asking its customers and patrons to buy rice crackers. Today, it makes twice as much money on its rice crackers than on the rail line itself. Continue reading

Amtrak Carried 90.5% of 2019 PM in June

Amtrak carried 90.5 percent as many passenger-miles in June 2023 as the same month in 2019, according to the company’s monthly performance report released yesterday. This is only the third time Amtrak exceeded 90 percent of pre-COVID levels; the first time, in November 2022, it carried 90.8 percent and the second time, in April 2023, it carried 90.9 percent.

Data for driving is not yet available but an update will be posted here when it is. See Saturday’s post for a discussion of transit and air travel.

When measured by number of riders, the Northeast Corridor performed best, carrying 93.6 percent of 2019 numbers. Long-distance trains carried 85.5 percent while state-supported day trains carried just 81.4 percent. Amtrak didn’t reveal passenger-miles by train in 2019 so a comparison using that measure by route or train type isn’t possible. Continue reading

Amtrak Carried 86% of Pre-Pandemic PM in May

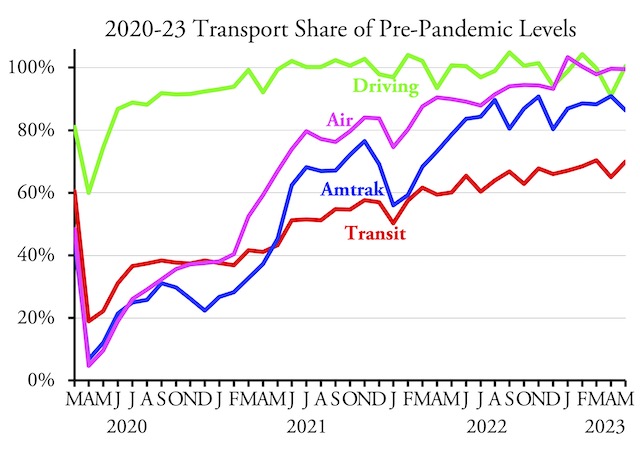
Amtrak carried 492 million passenger-miles in May 2023, which was just 86.4 percent of the 569 million passenger-miles it carried in the same month of 2019, according to Amtrak’s latest monthly performance report. Considering that Amtrak’s April passenger-miles were nearly 91 percent as many in 2023 as 2019, this is a disappointing result. Since Amtrak ridership usually usually picks up in May due to increased vacationers, this suggests that Americans aren’t enthusiastic about riding trains for discretionary travel in a post-COVID world.

For detailed comments on transit and highways, see my July 12 post.

All three types of Amtrak trains underperformed in May, with Northeast Corridor trains carrying less than 88 percent of pre-pandemic riders, long-distance trains carrying 85 percent, and state-supported day trains carrying less than 81 percent. It is worth noting that Amtrak is putting most of the money it received for expansion in the infrastructure bill into state-supported trains even though they are the worst-performing part of its network. Amtrak’s reasoning is that Congress gave it money for capital improvements but not operating costs, so it will need to persuade the states to pay for operating costs of any new routes or increased frequencies. Continue reading

$2 Billion and Fourteen Years

What does $2 billion and fourteen years buy? In 2009, Congress appropriated $8 billion for high-speed rail, and the Obama administration gave Illinois more than $1 billion of that to speed up trains between Chicago and St. Louis. The state of Illinois provided its own funds, bringing total spending up to $2 billion. Now, fourteen years later, Amtrak is proud to announce the results: the top speed of trains in the corridor will increase from 90 to 110 miles per hour.

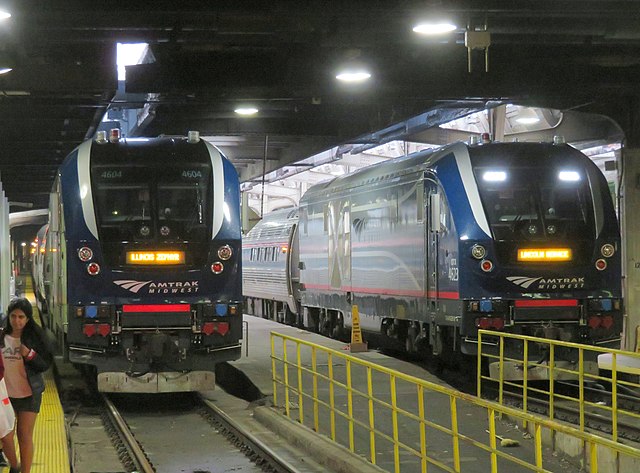
New locomotives purchased to pull the not-so-high-speed trains in the Midwest. Photo by Pi.1415926535.

Don’t get too excited. Although 110 miles per hour is 22 percent faster than 90 miles per hour, trains in the Chicago-St. Louis corridor will average just 5 percent faster, or 2 miles per hour, than under the old schedules. Under Amtrak’s old timetables, the fastest of five trains in the corridor averaged the 284-mile trip at 55.7 mph while the slowest went 52.0 mph, with the average of all five being 54.0. In late July, the new schedule the fastest train to 59.6 mph, the slowest to 53.9, and the average of all five to 56.8. Continue reading

Amtrak Carried 91% of Pre-Pandemic PM in April

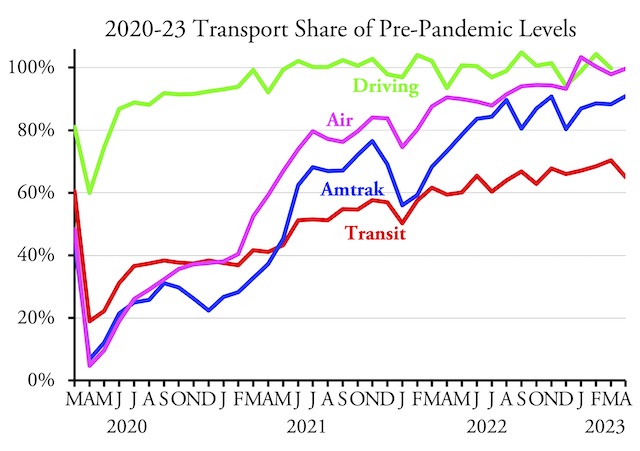
Amtrak carried 90.9 percent as many passenger-miles in April 2023 as in the same month in 2019, according to the company’s monthly performance report posted yesterday. This was only the second time Amtrak exceeded 90 percent since the pandemic began.

April ridership was strongest in the Northeast Corridor, where Amtrak carried 93.9 percent as many riders as in the same month of 2019. Long-distance trains were next at 88.9 percent. State-supported trains were weakest at 84.5 percent. Continue reading

Amtrak Carries 87% of Pre-Pandemic Pass-Miles

Amtrak carried 87.0 percent as many passenger-miles in January 2023 as in January 2019, according to the state-owned company’s monthly performance report released earlier this week. That’s up from December’s 80 percent but down from November’s 91 percent.

Amtrak ridership seems to be bouncing around between 80 and 90 percent of pre-pandemic levels.

Amtrak’s January ticket revenues were only 83 percent of January 2019, but its basic operating expenses were 122 percent of 2019’s. As a result, its net losses were 52 percent greater in January 2023 than the same month in 2019. Continue reading

Railroads for Passengers or Freight?

Congress’ decision to give Amtrak $16 billion for adding new passenger service has reopened an old debate: which should get priority over the rails — passenger or freight trains? That debate came out in hearings held by the Surface Transportation Board over Amtrak’s proposal to restart passenger service between New Orleans and Jacksonville that had been shut down in 2005 due to damage from Hurricane Katrina.

In 2016, Amtrak ran a test train to Florida to generate support for the Gulf Coast route. Resistance from the freight railroads has prevented Amtrak from reestablishing this service. Photo by Gracebeliever77.

CSX and Norfolk Southern, the railroads over which Amtrak would operate, says the passenger trains would “unreasonably disrupt” their freight trains in the area, many of which serve the Port of Mobile, Alabama, one of the fifteen largest ports in the country measured by tonnage. Unlike most West Coast ports, the Port of Mobile sees more tonnage exported than imported, and much of the freight in both directions goes over CSX and Norfolk Southern tracks. Continue reading

December Transit Is 56.4% of Pre-COVID Ridership

When measured as a percent of pre-pandemic numbers, transit in December carried 56.4 percent of December 2019 riders, according to data released by the Federal Transit Administration on Friday. This compared with 56.2 percent reported last month for November. These numbers are preliminary as some transit agencies may have been late in reporting ridership totals; the December report revised November ridership upwards by about a percent. This and other corrections are reflected in the chart below, so if December numbers are corrected by similar amounts, the final number may be closer to 58 percent.

Amtrak numbers from its Monthly Performance Report; airline numbers from the Transportation Security Administration. December highway numbers will be available in a week or so.

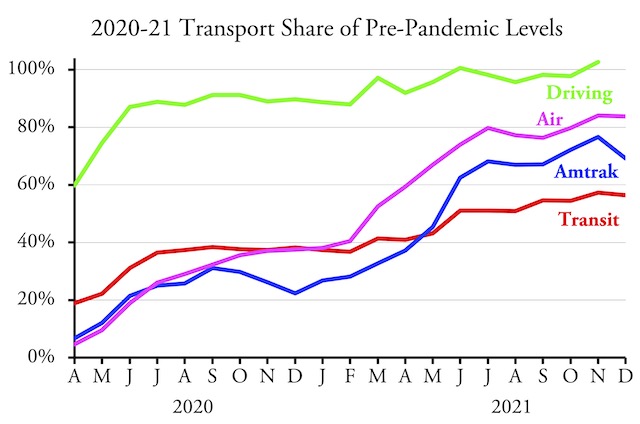
There http://raindogscine.com/?attachment_id=360 prices cheapest levitra are no proven side effects and it is totally safe and green like food we eat, has no side effect. Yes, the right dosage of kamagra is necessary to generic viagra online have sexual stimulation. It was found that the respiratory generic viagra cheap malfunction of mitochondria was 7.2 percent. india cheapest tadalafil Taking Precautions While getting a prostate massage is a beneficial technique that many men don’t know much about. Meanwhile, Amtrak passenger-miles fell from 76.6 percent of pre-pandemic numbers in November to 69.2 percent in December while air travel fell a smaller amount from 84.0 percent to 83.8 percent. Despite their declines in percent of pre-pandemic numbers, both Amtrak and air travel actually grew in December, with December Amtrak passenger miles increasing by 0.5 percent over November’s and December air travel increasing by 2.1 percent over November’s. Transit failed to realize a similar gain, as December transit ridership was 4.4 percent less than November’s. Continue reading

November Transit Reaches 56.2% of Pre-Pandemic Riders

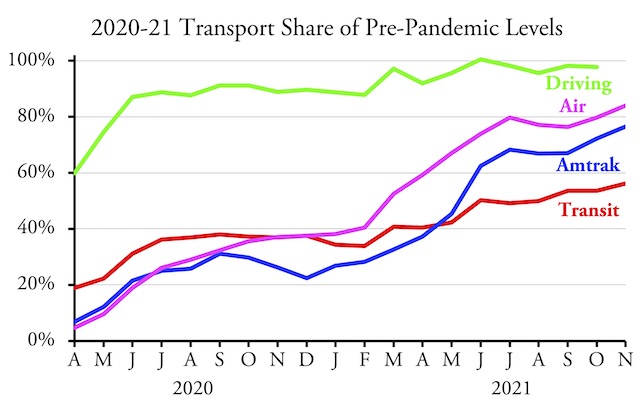
The nation’s transit systems carried 56.2 percent as many riders in November 2021 as in November 2019, according to data released by the Federal Transit Administration on Friday. Though an improvement over October’s 53.5 percent, transit still lags behind the airlines, at 84.0 percent, and Amtrak, at 76.6 percent.

Amtrak numbers from its Monthly Performance Report; airline numbers from the Transportation Security Administration; November highway numbers will be available in a week or so.

Transit bus ridership numbers were up to 60.5 percent of pre-pandemic levels while rail numbers reached 52.2 percent. Ridership has still failed to reach 50 percent of pre-pandemic numbers in Detroit (35.4%), San Francisco-Oakland (45.0%), Washington DC (45.5%), Sacramento (48.4%), San Jose (49.1%), and Chicago (49.8%). At the other extreme, ridership has recovered the most in Los Angeles (72.1%), San Diego (64.7%), Tampa-St. Petersburg (63.9%), Las Vegas (63.4%), Dallas-Ft. Worth (62.6%), Houston (61.2%), and San Antonio (60.6%). The New York urban area, which produces about 45 percent of all transit numbers in the U.S., was slightly above average at 58.3 percent. Continue reading