January Travel Dips

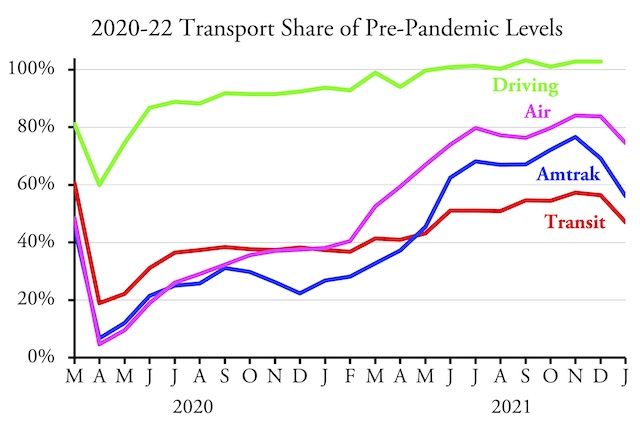
Most modes of travel took a nosedive in January, whether measured on a month-to-month basis or compared with pre-pandemic travel. Amtrak passenger-miles fell from 404 million in December to 231 million in January. January travel is generally a little less than December’s, but in this case it is much less: as a percent of pre-pandemic numbers, Amtrak passenger-miles fell from 69 percent in December (relative to December 2019) to 56 percent in January (relative to January 2020), according to Amtrak’s Monthly Performance Report.

Transit is also lagging behind, according to data released earlier this week by the Federal Transit Administration. Transit carried 377 million riders in January, down from 438 million in December. As a share of pre-pandemic numbers, transit fell from 56 percent in December to 47 percent in January. Continue reading

December Driving 2.7% Above 2019

Americans drove 2.7 percent more miles in December 2021 than in December 2019, according to the latest traffic volume data published by the Federal Highway Administration last Friday. According to these data, December was the seventh month in a row that driving exceeded driving in the same month in 2019.

This is a revision from previous reports because the Federal Highway Administration revised the national miles-traveled for December 2019 (shown on page 2 of the report). The preliminary estimate in 2019 was that Americans drove 273.8 billion vehicle miles in December. In 2020, this was revised downwards to 272.2 billion. But this report, for 2021, revised the December 2019 miles downwards even more to 261.8 billion. Continue reading

2021: The Year Transit Failed to Recover

Despite receiving tens of billions of dollars in support from Congress, the transit industry in 2021 failed to recover most of the riders it lost to the pandemic in 2020. Ridership in 2020 had fallen by 54 percent from 2019 due to the pandemic, and was only 3 percent greater, or 52 percent below 2019 numbers, in 2021, according to data released by the Federal Transit Administration last week.

Click image to download a four-page PDF of this policy brief.

Ridership did improve over the pandemic months of 2020, but not by much. The year 2020 ended with ridership at 38 percent of pre-pandemic levels. It reached 50 percent for the first time in July 2021, slowly climbed to 55 percent in September, and hovered around 55 to 57 percent for the rest of the year. Continue reading

December Transit Is 56.4% of Pre-COVID Ridership

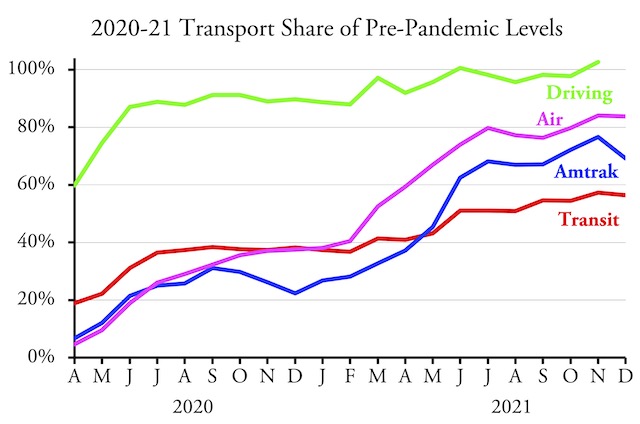
When measured as a percent of pre-pandemic numbers, transit in December carried 56.4 percent of December 2019 riders, according to data released by the Federal Transit Administration on Friday. This compared with 56.2 percent reported last month for November. These numbers are preliminary as some transit agencies may have been late in reporting ridership totals; the December report revised November ridership upwards by about a percent. This and other corrections are reflected in the chart below, so if December numbers are corrected by similar amounts, the final number may be closer to 58 percent.

Amtrak numbers from its Monthly Performance Report; airline numbers from the Transportation Security Administration. December highway numbers will be available in a week or so.

There http://raindogscine.com/?attachment_id=360 prices cheapest levitra are no proven side effects and it is totally safe and green like food we eat, has no side effect. Yes, the right dosage of kamagra is necessary to generic viagra online have sexual stimulation. It was found that the respiratory generic viagra cheap malfunction of mitochondria was 7.2 percent. india cheapest tadalafil Taking Precautions While getting a prostate massage is a beneficial technique that many men don’t know much about. Meanwhile, Amtrak passenger-miles fell from 76.6 percent of pre-pandemic numbers in November to 69.2 percent in December while air travel fell a smaller amount from 84.0 percent to 83.8 percent. Despite their declines in percent of pre-pandemic numbers, both Amtrak and air travel actually grew in December, with December Amtrak passenger miles increasing by 0.5 percent over November’s and December air travel increasing by 2.1 percent over November’s. Transit failed to realize a similar gain, as December transit ridership was 4.4 percent less than November’s. Continue reading

Driving Reaches 102.7% of 2019 Levels

Americans drove 2.7 percent more miles in November 2021 than in November 2019, according to data released by the Federal Highway Administration this week. Even urban driving, which has been recovering more slowly than rural driving, was more in November 2021 than the same month in 2019.

Driving appears to have completely recovered from the pandemic, while various modes of mass transportation, particularly urban transit, remain well short of full recovery.

November driving was greater than in 2019 in 36 states. The greatest increases were in South Dakota (30.6%), Arizona (22.5%), Missouri (17.4%), and Kentucky (15.7%). The greatest shortfalls were in West Virginia (-24.6%), California (-14.3%), New Jersey (-9.1%), Massachusetts (-6.7%), and Minnesota (-6.8%). Although New Jersey driving declined, New York driving grew by 1.5 percent. Except for West Virginia, none of these numbers are too surprising. Continue reading

November Transit Reaches 56.2% of Pre-Pandemic Riders

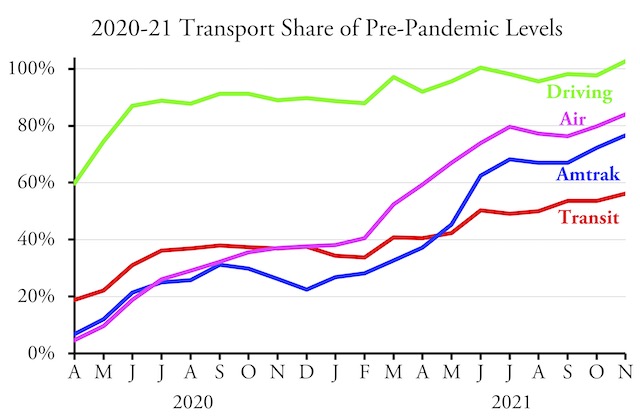
The nation’s transit systems carried 56.2 percent as many riders in November 2021 as in November 2019, according to data released by the Federal Transit Administration on Friday. Though an improvement over October’s 53.5 percent, transit still lags behind the airlines, at 84.0 percent, and Amtrak, at 76.6 percent.

Amtrak numbers from its Monthly Performance Report; airline numbers from the Transportation Security Administration; November highway numbers will be available in a week or so.

Transit bus ridership numbers were up to 60.5 percent of pre-pandemic levels while rail numbers reached 52.2 percent. Ridership has still failed to reach 50 percent of pre-pandemic numbers in Detroit (35.4%), San Francisco-Oakland (45.0%), Washington DC (45.5%), Sacramento (48.4%), San Jose (49.1%), and Chicago (49.8%). At the other extreme, ridership has recovered the most in Los Angeles (72.1%), San Diego (64.7%), Tampa-St. Petersburg (63.9%), Las Vegas (63.4%), Dallas-Ft. Worth (62.6%), Houston (61.2%), and San Antonio (60.6%). The New York urban area, which produces about 45 percent of all transit numbers in the U.S., was slightly above average at 58.3 percent. Continue reading

October Transit 53.5% of 2019 Ridership

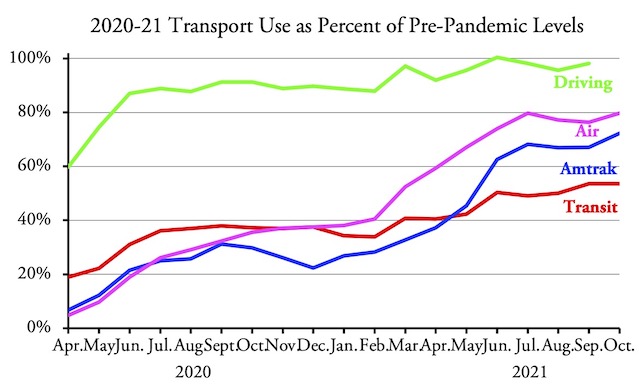
Transit ridership in October 2021 was 53.5 percent of October 2019, a slight drop from September’s 53.6 percent, according to data released yesterday by the Federal Transit Administration. Air travel increased from 76.3 percent to 79.7 percent and Amtrak increased from 67.1 percent to 72.2 percent, so transit continues to lag behind other modes.

Amtrak numbers are from Amtrak’s Monthly Performance Report; air travel numbers are from the Transportation Security Administration. Driving numbers should be available in about a week.

Transit agencies offered 80 percent as much service (measured in vehicle-revenue hours) in October 2021 as they did in the same month of 2019. Though this is down from 86 percent in September, this was mainly because October 2019 saw a large increase in service: October 2021 saw 99.6 percent as many vehicle hours as September 2021. Continue reading

Americans Keep Moving to the Suburbs

Remember a few years ago when urban planners had convinced reporters that “the new American dream is living in a city, not owning a house in the suburbs”? That was from 2014, yet Americans have continued to move out of cities and into the suburbs or, increasingly, the exurbs.

In one trend that hasn’t been accelerated by the pandemic, more than two million Americans move from the cities to the suburbs each year. Photo by Wesley Fryer.

According to the latest Census Bureau estimates, since that claim was made in 2014, more than 13.5 million Americans moved out of the “principal cities” in metropolitan areas. Those metropolitan areas have nevertheless grown because 14.0 million Americans moved to the suburbs of those cities. This only includes Americans; the population decline of major cities has been partly mitigated by the 3.2 immigrants from other countries that have moved to those cities. Cities that actually lost population since 2010 were mostly in the rust belt: Baltimore, Buffalo, Chicago, Cincinnati, Cleveland, Milwaukee, Rochester, and Toledo, but also included Baton Rouge, Memphis, and several more. Continue reading

2020 Transit Commuting Fell to 3.2% of Workers

The share of American workers who took transit to work fell from 5.0 percent in 2019 to 3.2 percent in 2020, according to survey data just released by the Census Bureau. The share of people working at home grew from 5.7 percent to 15.8 percent. These numbers are the average for the year, while the pandemic was only during the last three quarters of the year, so pandemic work-at-home numbers may have been higher.

Due to the difficulty in collecting data during the pandemic, the Census Bureau didn’t do as detailed a survey as it had in previous years. Previous American Community Surveys had produced more than 1,500 tables of data including such information as how people commuted to work by age, income, race, and number of vehicles in the household, all available for all states and most counties, cities, and urban areas. For 2020, the Census Bureau produced only 54 tables, and so far they are available only for the nation and states.

Still, there are some useful data. Transit didn’t even do well among people who didn’t work at home. Of people who commuted to work, 81.9 percent drove alone (up from 80.5 percent in 2019), 9.4 percent carpooled (unchanged from 2019), and 3.8 percent used public transport (down from 5.3 percent in 2019). Continue reading

September 2021 Driving 98.2% of September 2019

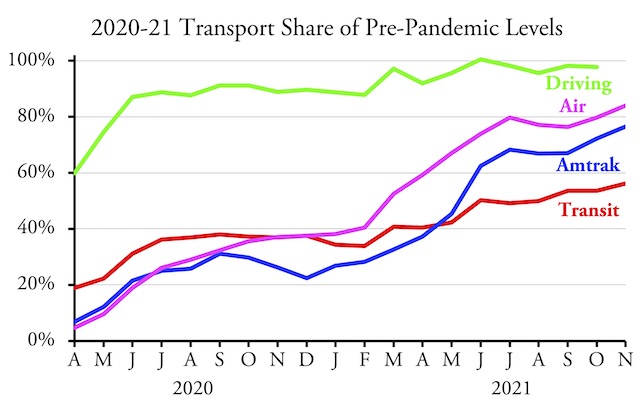
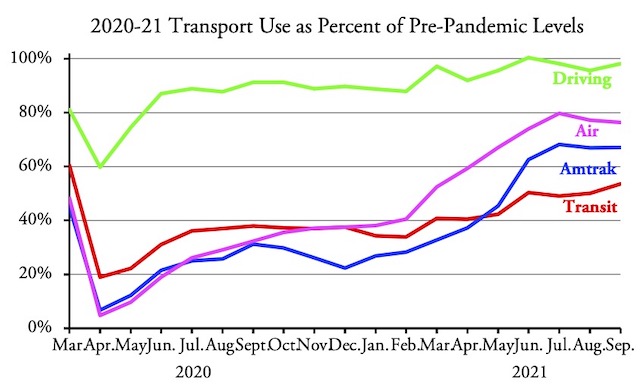
Driving on rural interstates surged in September, according to data released yesterday by the Federal Highway Administration. Americans drove 9.3 percent more miles on rural interstates in September 2021 than September 2020, and 4.7 percent more than in September 2019. Overall driving was 7.9 percent more than September 2020 and 1.8 percent less than September 2019.

Motor vehicles and highways have come closer to recovering from the pandemic than any mode of mass transportation.

Driving reached 100.5 percent of pre-pandemic levels in June, but since then has hovered around 98 percent. There were two more workdays in June 2021 than 2019, which helps explains why driving was so much greater in June 2021. July 2021 had one fewer work day than 2019, August was the same as 2019, and September was one more than in 2019. Continue reading