Americans drove 94.2 percent as many miles in December, 2022 as they did in the same month before the pandemic, according to data released by the Federal Highway Administration yesterday. Total driving for the year was 97.2 percent of 2019.
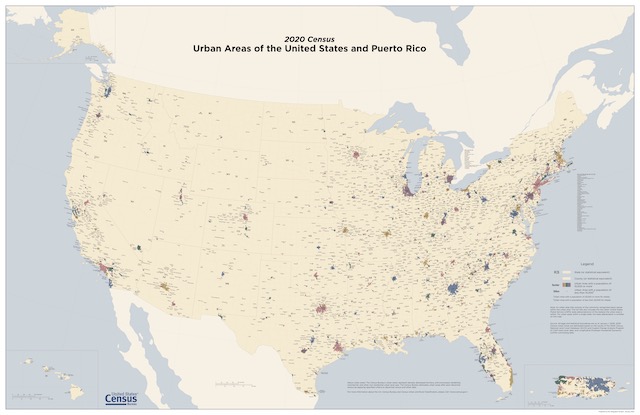
Both urban and rural driving fell short of pre-pandemic levels in December. Americans drove about 99 percent as many miles in rural areas but only 92 percent as many miles in urban areas as in 2019. Continue reading