Planning for an Unattainable Fantasy

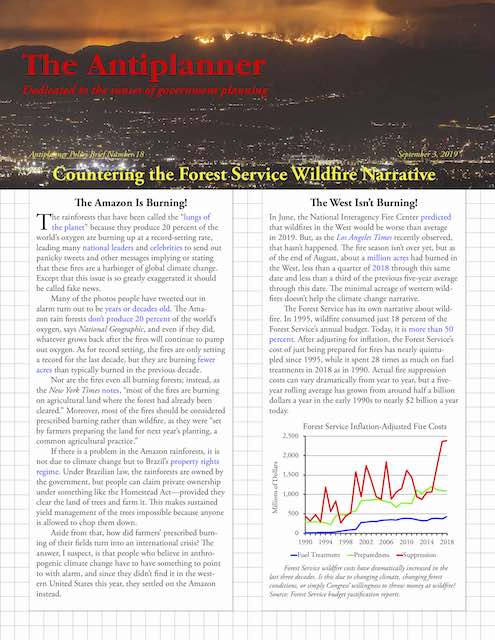
Austin is one of the fastest-growing cities in America, and the city of Austin and Austin’s transit agency, Capital Metro, have a plan for dealing with all of the traffic that will be generated by that growth: assume that a third of the people who now drive alone to work will switch to transit, bicycling, walking, or telecommuting by 2039. That’s right up there with planning for dinner by assuming that food will magically appear on the table the same way it does in Hogwarts.


Click image to download a 4-page PDF of this policy brief.

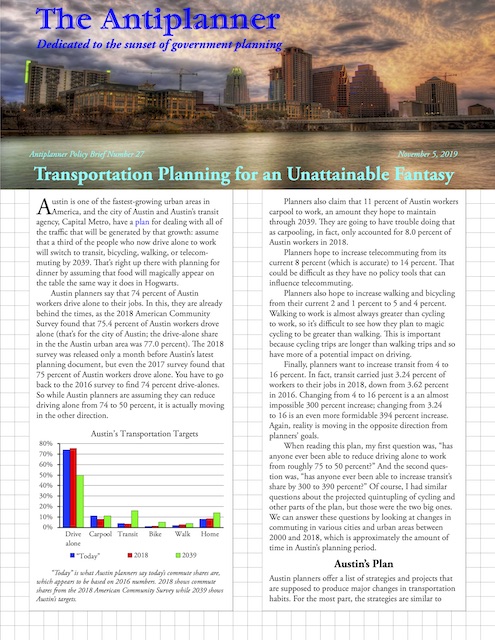
Austin planners say that 74 percent of Austin workers drive alone to their jobs. In this, they are already behind the times, as the 2018 American Community Survey found that 75.4 percent of Austin workers drove alone (that’s for the city of Austin; the drive-alone share in the the Austin urban area was 77.0 percent). The 2018 survey was released only a month before Austin’s latest planning document, but even the 2017 survey found that 75 percent of Austin workers drove alone. You have to go back to the 2016 survey to find 74 percent drive-alones. So while Austin planners are assuming they can reduce driving alone from 74 to 50 percent, it is actually moving in the other direction. Continue reading

Scapegoating Ride Hailing

Transit ridership in Chicago is declining. The city wants to tax ride-hailing companies such as Uber and Lyft and give some of the money to the Chicago Transit Authority (CTA). To justify this, it has written a report blaming ride-hailing companies for increased congestion, air pollution, and wear-and-tear on roads.

Click image to download a three-page PDF of this policy brief.

The report admits that ride-hailing services “are not the sole reason for increasing congestion and gridlock in Chicago,” but claims that “our analysis shows they are a significant contributing factor.” In fact, the “analysis” shows nothing of the kind. A close look at the data shows that ride hailing still plays an insignificant role in Chicago congestion and may actually reduce air pollution and wear-and-tear on roads. Continue reading

Making Cities Safe for Pedestrians & Cyclists

In 2008, wildfires in Butte County, California led to the evacuation of 9,000 people from the town of Paradise. Fortunately, firefighters saved the town from any damage, but severe delays during the evacuation led a grand jury to warn that Butte County needed to upgrade evacuation routes, which then consisted of three two-lane roads and a four-lane road.

Click image to download a 5-page PDF of this policy brief.

Instead, prompted by a state grant, officials put the four-lane road on a “road diet,” reducing it to two lanes of travel. Obstacles known as “traffic calming measures” were installed throughout the town, including bump-out’s, center medians, and extended sidewalks. Continue reading

The Case for Single-Family Neighborhoods

Housing prices continue to rise and in many places they now exceed prices at the peak of the 2006 housing bubble. Incomes in many regions have failed to rise to match those prices, with the result that housing is unaffordable—that is, median home prices are at least four times median family incomes—in California, Colorado, Hawaii, Nevada, Oregon, and Washington, as well as the Boston, Miami, and New York urban areas.

Click image to download a PDF of this five-page policy brief.

Prices are high in these areas because of urban-growth boundaries or other restrictions on development of rural areas at the urban fringes of these states and regions. Collectively known as growth management, such restrictions increase the price of developable land, allow cities to impose development restrictions without fear that developers will go outside the cities, and increase labor costs as home construction workers fight to find affordable housing along with everyone else. Continue reading

Home Prices Rise Higher in Restricted Areas

For the first time since the financial crash, the median U.S. home price crept up above three times median family incomes in 2018, according to the 2018 American Community Survey (ACS). Places with price-to-income ratios under 3 are affordable (meaning people can easily pay off a mortgage on a house that is three times their income); price-to-income ratios between 3 and 4 are marginally affordable; price-to-income ratios between 4 and 5 are unaffordable; and price-to-income ratios above 5 are extremely unaffordable.


Click image to download a PDF of this four-page policy brief.

The U.S. price-to-income ratio is barely in the “marginal” class, as it is under 3.007. But it has reached this level because several states continue to allow their anti-sprawl policies to push housing prices up in the unaffordable or extremely unaffordable categories. Rather than fix the problem, planners are attempting to blame expensive housing on single-family homeowners who don’t want to see multifamily housing built in their neighborhoods. Continue reading

2018 Census Data Show Transit in Decline

The Census Bureau released data from the 2018 American Community Survey last week, and the big news is its finding that income inequality has worsened. America’s transit agencies contributed to that problem as they continue to build expensive transit systems into wealthy suburbs while they cut service to low-income neighborhoods.

Click image to download a PDF of this four-page policy brief.

As a result, people who earned less than $25,000 a year were 6 percent less likely to commute to work by transit in 2018 than people in the same income class in 2010, while people who earned $65,000 a year or more were 7 percent more likely to commute by transit. Moreover, the median income of transit commuters rose above the median income of people who commute in single-occupancy automobiles for the first time since the Census Bureau began keeping track of this information in 1960. Continue reading

How New Starts Harms Transit Riders

Rail transit lines built with federal support have done more harm than good to transit riders and urban transportation systems as a whole. Too often, the high cost of rail has forced transit agencies to cut bus service and raise fares. In the worst cases, the systems lost more bus riders than they gain rail riders. In most other cases, per capita ridership and/or transit’s share of commuting declined. These regions and transit systems would have been better off without the federal government enticing them into build rail transit.

Click image to download a 6-page PDF of this policy brief.

A little over a century ago, more than a thousand American cities, including every city with more than 15,000 people, had some form of rail transit. Then, in 1927, the first buses were produced that cost less both to buy and to operate than rail transit. By then, many of the rail lines built in the nineteenth century were wearing out, so transit riders appreciated the buses because they were faster and more comfortable than the railcars and could easily take on new routes. Buses can also move more people per hour than almost any rail line because buses, though having lower capacities per vehicle, can safely operate far more frequently than rail lines. Continue reading

Transport Costs & Subsidies by Mode

Supporters of increased subsidies to urban transit and intercity passenger trains often argue that all transportation is subsidized, so it’s only fair that transit and Amtrak should also be subsidized. While it’s true that most transportation is subsidized, it is worth looking at the extent of those subsidies to judge whether subsidies to some forms of transport should be increased or reduced.

Click image to download a four-page PDF of this policy brief.

Americans spent about $1.3 trillion of their personal incomes on transportation in 2017 (based on the Bureau of Economic Analysis’ National Income and Product Accounts (NIPA) table 2.5.5, lines 53 and 116). On top of this, transportation received about $200 billion in subsidies from federal, state, and local governments (based on subtracting total government expenditures on transport from total government revenues from transport). Continue reading

Congestion Is a Problem, Not a Solution

Phoenix has seen the least increase in congestion of any major urban area in America. According to the data set accompanying the Texas Transportation Institute’s recently released 2019 Urban Mobility Report, the average commuter in Phoenix suffered from 80 hours of delay in 2017, up 26 hours from 1982. That compares with an 82-hour growth in delay per commuter in the San Francisco and Washington urban areas and an average 53-hour increase in delay for the nation’s top 50 urban areas.[*]

Click image to download a four-page PDF of this policy brief.

Phoenix’s relatively small increase in traffic congestion is largely due to the massive increase in freeways in the region. According to an earlier edition of the urban mobility report, Phoenix had 210 lane-miles of freeways in 1982, growing to 2,015 by 2017. Part of this increase was due to an expansion of the urban area, leading to the addition of freeways that already existed but were previously outside the urban area. But the region has little more than doubled in land area since 1982 while the freeway lane-miles increased by nearly ten times. No other region has seen such a large increase in freeway lane-miles. Continue reading

Countering the Forest Service Fire Narrative

The Amazon Is Burning!

The rainforests that have been called the “lungs of the planet” because they produce 20 percent of the world’s oxygen are burning up at a record-setting rate, leading many national leaders and celebrities to send out panicky tweets and other messages implying or stating that these fires are a harbinger of global climate change. Except that this issue is so greatly exaggerated it should be called fake news.

Click image to download a four-page PDF of this policy brief.

Many of the photos people have tweeted out in alarm turn out to be years or decades old. The Amazon rain forests don’t produce 20 percent of the world’s oxygen, says National Geographic, and even if they did, whatever grows back after the fires will continue to pump out oxygen. As for record setting, the fires are only setting a record for the last decade, but they are burning fewer acres than typically burned in the previous decade. Continue reading