Why Save Obsolete Transportation?

David Zipper, who has a master’s degree in urban planning, writes on Vox about how transit agencies need to save themselves from a fiscal cliff. To do so, he says, they must “secure new and reliable revenue streams from state and regional sources.” To convince skeptical members of the public they need to provide those revenue streams out of their taxes, agencies need to “demonstrate an ability to replace car trips, not just serve economically disadvantaged people,” because only by replacing car trips can they prove they are “curtailing congestion, reducing auto emissions, and boosting economic growth.”

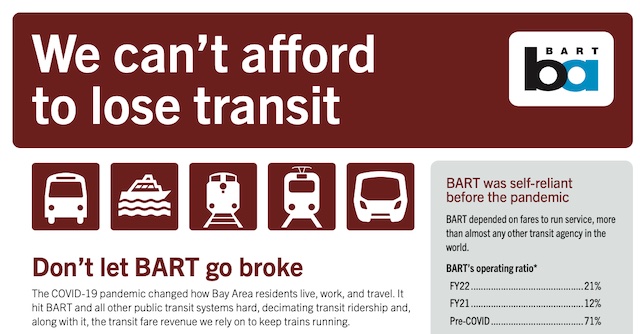
BART’s plea for more subsidies falsely claims that “BART was self-sufficient before the pandemic” when its own data show that fares covered only 71 percent of operating costs and zero percent of capital costs.

Yet Zipper never really says why we need to save transit. He claims that transit has been “indispensable” for major metros, but what he really means is that it is indispensable for major downtowns such as Chicago, Philadelphia, and San Francisco. In reality, the only metro area for which transit is truly indispensable is New York, and if it is so indispensable there, then New Yorkers should be the ones to pay for it. Continue reading

Tax Netflix to Fund Transit?

New York’s Metropolitan Transportation Authority will soon go off a fiscal cliff, partly due to reduced ridership but also due to bad management. But never fear: New York legislators have a solution. They propose to tax Netflix and Uber to raise money to keep the subways and buses running.

One of the most expensive transit projects in the world, the Second Avenue Subway is expensive partly because the MTA spent more on consultants than it did on actual construction. MTA Capital Construction photo by Rehema Trimiew.

Taxing Uber makes kind of a warped sense, like taxing jet airliners in order to subsidize Conestoga wagons. But taxing Netflix? Just what does Netflix have to do with urban transit? Next thing you know, someone will propose taxing people for working at home because, you know, homes are “stealing” riders away from transit. Continue reading

Transit Agencies Go Insane

Earlier this month, the Federal Transit Administration published its annual report on funding recommendations for transit capital improvement grants. Each year, I review the accompanying list of projects being planned or under construction to see how much construction costs have grown since the previous year. This year, however, transit agencies seem to have learned a lesson from the pandemic and have curtailed their wild spending on pointless projects.

Sound Transit is building light rail on what was once freeway lanes across Lake Washington. Photo by Sound Transit.

Just kidding. In fact, they are spending more than ever. In the 1990s, light-rail lines that cost $50 million a mile ($100 million in today’s dollars) were considered extravagantly expensive. A decade ago, the average light-rail line cost about $125 million a mile ($160 million in today’s dollars). Last year, average light-rail construction costs had risen to $278 million a mile (about $310 million today). Continue reading

Promise Rapid Transit, Deliver Streetcars

On November 2020, in the midst of the pandemic, Austin voters foolishly agreed to raise property taxes in order to build 28 miles of light rail at a projected cost of $5.8 billion. To avoid congestion, the downtown portion of light-rail lines would go through a four-mile-long tunnel.

Artist’s impression of light rail running near downtown Austin.

No one reading this blog will be surprised to know that, in the short amount of time since then, projected costs have nearly doubled to $10.3 billion. Early this week, the city’s transit planners announced a new plan that would build fewer than half as many miles of light rail. Continue reading

January Driving 98.9% of 2019

Americans drove 98.9 percent as many miles in January 2023 as they did in the same month of 2019, according to data released by the Federal Highway Administration yesterday. Driving in rural areas averaged 4.6 percent greater than in 2019, while driving in urban areas was about 3.4 percent less.

Amtrak numbers are from the company’s monthly performance report; see this post for a discussion of those numbers. Transit numbers are from the Federal Transit Administration and air travel numbers are from the Transportation Security Administration; see this post for a discussion of those numbers.

January’s urban driving exceeded 2019 miles in 20 states. The biggest gains were in Rhode Island (up 22%), Louisiana (10%), Idaho (8%), New Jersey (8%), Texas (7%), and Pennsylvania (5%). The biggest shortfalls in urban driving were in Michigan (down 16%), Colorado (-16%), Arkansas (-15%), North Dakota (-14%), and Hawaii (-13%). Continue reading

Portland Bicycle Ridership Declining

Portland, Oregon has 385 miles of bikeways, 121 of which have been built since 2014. But these bikeways have failed to boost the number of bicycle riders in the city. In fact, a report from the city of Portland says that, in the wake of COVID, the number is declining rapidly.

According to the Census Bureau’s American Community Survey, the share of Portland employees riding bicycles to work peaked at 7.2 percent in 2014. By 2019, it had fallen to 5.2 percent. The pandemic led to a surge in bicycle sales, and the share grew to 5.4 percent in 2020 but then fell dramatically to a measly 2.8 percent in 2021. Continue reading

Metro Transit Spends Millions on Transit Security

Minneapolis-St. Paul’s Metro Transit is going to spend $3 million a year hiring private security to deter crime at six of the region’s light-rail stations. As the Antiplanner recently documented, light rail attracts more crime than any other form of transit and the Twin Cities’ light rail attracts far more crime than any other light-rail system in the United States.

Patrons of the Twin Cities’ light-rail system suffer nearly twice as much crime as those of the next-highest system and at least six times as much as those of all but three other systems. Click image to download the Antiplanner’s report on Minnesota transportation in a post-COVID world.

Light rail attracts crime because fare enforcement is spotty and potential criminals figure that, if they can ride the trains for free, they can get away with other crimes as well. The Antiplanner recommended that Metro Transit install gates at every light-rail station, similar to those used for heavy-rail lines, but Metro Transit rejected this idea. Continue reading

Amtrak Carries 87% of Pre-Pandemic Pass-Miles

Amtrak carried 87.0 percent as many passenger-miles in January 2023 as in January 2019, according to the state-owned company’s monthly performance report released earlier this week. That’s up from December’s 80 percent but down from November’s 91 percent.

Amtrak ridership seems to be bouncing around between 80 and 90 percent of pre-pandemic levels.

Amtrak’s January ticket revenues were only 83 percent of January 2019, but its basic operating expenses were 122 percent of 2019’s. As a result, its net losses were 52 percent greater in January 2023 than the same month in 2019. Continue reading

BART Is in Self-Destruct Mode

The San Francisco Bay Area Rapid Transit Authority (BART) spends a lot of money, and anytime a government agency has a lot of money to spend, there is a potential for corruption. For example, a month ago it was revealed that BART spent $350,000 to help one homeless person.

These $2 million cars were recently delivered to BART along with three times the service delays as the 40-year-old cars they replaced, which is a problem that should have been examined by the inspector general.

That revelation came from the BART Inspector General’s office, which was created in 2018 (about 50 years too late) to monitor BART spending. But BART itself hasn’t been too thrilled about having someone look over its shoulder. Continue reading

Transit Ridership Falls in January

Transit carried 66.4 percent as many riders in January 2023 as January 2019, according to data released by the Federal Transit Administration earlier this week. Though this is a slight improvement from the 66.0 percent of December 2022, the total number of January riders was lower than December’s. This is unusual: normally, January sees more riders than December. January 2023 had one fewer working day than January 2019, which may have contributed to the decline in ridership from December.

Transit ridership has hovered around 66 percent of pre-pandemic (2019) numbers for the last five months, suggesting it may not grow much further. Early in the pandemic, I predicted that ridership would never recover to more than 75 percent of pre-pandemic levels, which I later revised downwards to 70 percent (a projection supported by McKinsey). That’s looking to be slightly too high. Continue reading