When the Federal Transit Administration released the 2022 National Transit Database, it also released updated time series data tables. These tables have operating data (including costs and ridership) from 1991 through 2022, capital costs from 1992 through 2022, and fare revenues from 2002 through 2022.
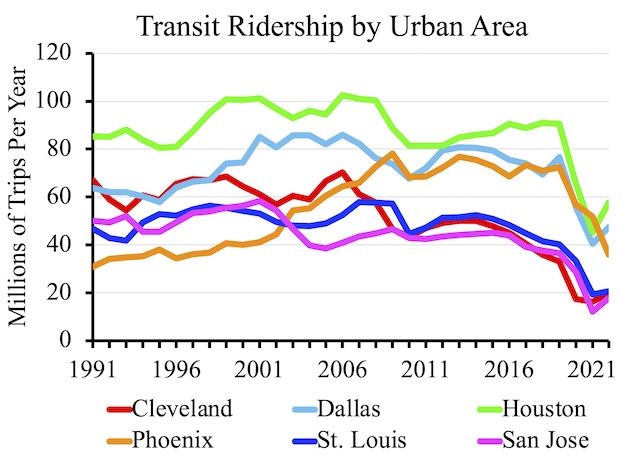
This chart shows ridership for six urban areas that I consider to be basket cases, with ridership steadily declining despite — or more likely because of — the construction of light-rail or some other transit infrastructure. Of course, ridership declined everywhere due the pandemic, but most of these are among the slowest to recover to their already low 2019 levels.
The release includes six data tables, but I find just two of them useful as they are the only two that break down data by mode. Table TS3.1 has capital costs by transit agency and mode. Table TS2.1 has all other information — operating costs, fares, service in miles and hours, ridership, passenger-miles, and miles of rail lines — by agency and mode. Continue reading


