
Transit is often touted as a way to save energy. But since 2009 transit has used more energy, per passenger mile, than the average car. Since 2016, transit has used more than the average of cars and light trucks together.
 Click image to download a four-page PDF of this policy brief.
Automobiles and planes are becoming more energy efficient each year. But the annual reports of the National Transit Database reveals that urban transit is moving in the opposite direction, requiring more energy to move a person one mile in each of the last four years.
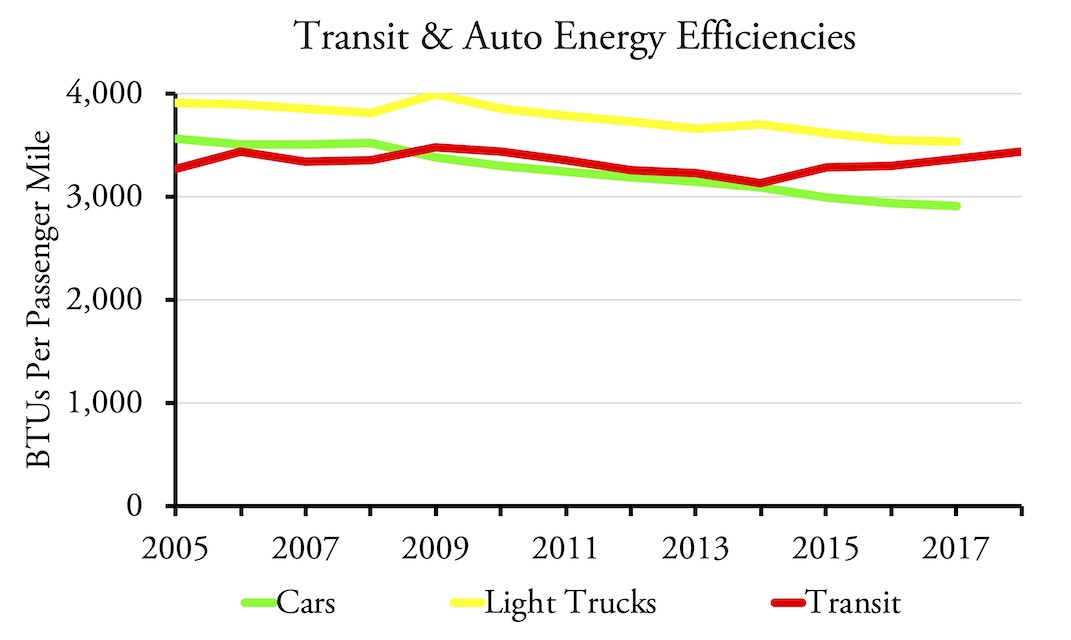
Transit has been less energy efficient than the average car since 2009. Light trucks (vans, pickups, SUVs) may soon become more efficient than transit as well. 2018 automobile data are not yet available; 2017 numbers are estimated from this report; prior years are from the Transportation Energy Databook.
The reason for this is simple: ridership is declining, but transit agencies aren’t proportionately reducing miles of transit service. As a result, the average occupancies of buses and other transit vehicles has declined in every year since 2013. While transit agencies may be purchasing more fuel-efficient vehicles, the increase in average efficiencies per vehicle mile can’t make up for the loss in passengers.
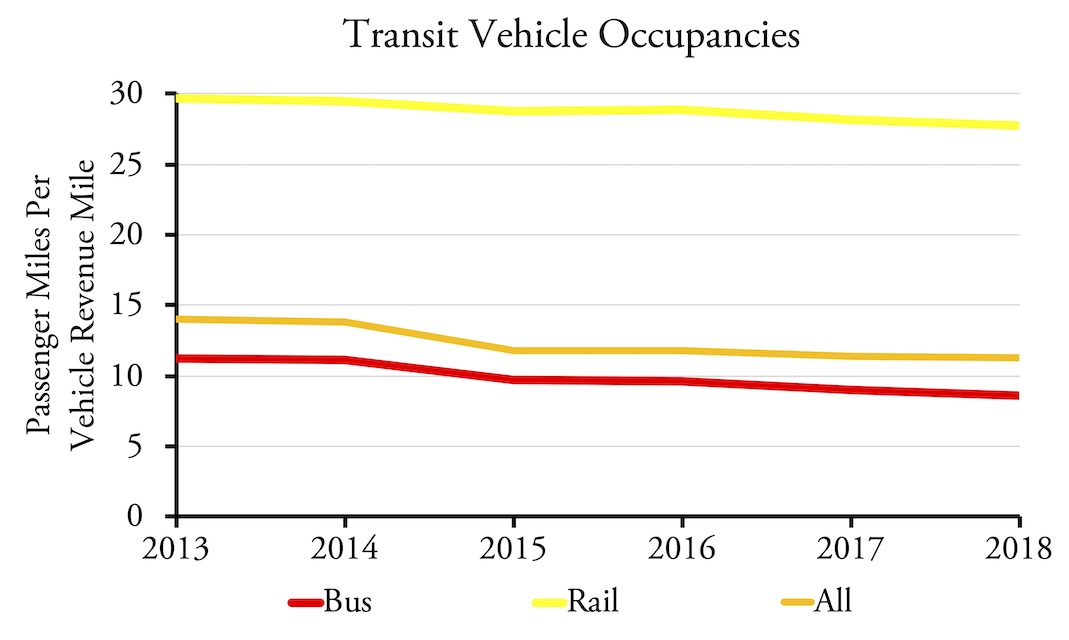
Transit occupancies have steadily declined since 2013. Bus” includes commuter bus, rapid bus, trolley bus, and conventional bus (which the FTA calls “motor bus”). “Rail” includes commuter, heavy, light, and hybrid rail and streetcars, but not monorail or automated guideways. “All” includes all transit, not just bus and rail.
These numbers are based on the National Transit Database, which reports the number of gallons of Diesel fuel, gasoline, natural gas, and other fuels as well as the number of kilowatt-hours of electricity that are used by transit systems across the country. I’ve converted these numbers to British thermal units (BTUs) using standard factors, such as that a gallon of Diesel fuel has 138,500 BTUs.
For electricity, I also took into account the fact that two-thirds of the energy used in a power plant is lost in generation and transmission. In other words, in order to deliver 1 kilowatt-hour (3,412 BTUs) of energy to a customer, an electrical system must consume the equivalent of 10,236 BTUs of fossil fuels or other energy at the power plant. Electric motors tend to be more efficient than internal combustion engines, but when the losses from generation and transmission are accounted for, the efficiencies are about the same.
Energy Consumption by Mode
The calculations show that ferries and streetcars use huge amounts of energy per passenger mile, as do automated guideways (i.e., people movers), which aren’t shown in the chart but average even more energy per passenger mile than ferries. Buses and light rail are well above the average automobile.
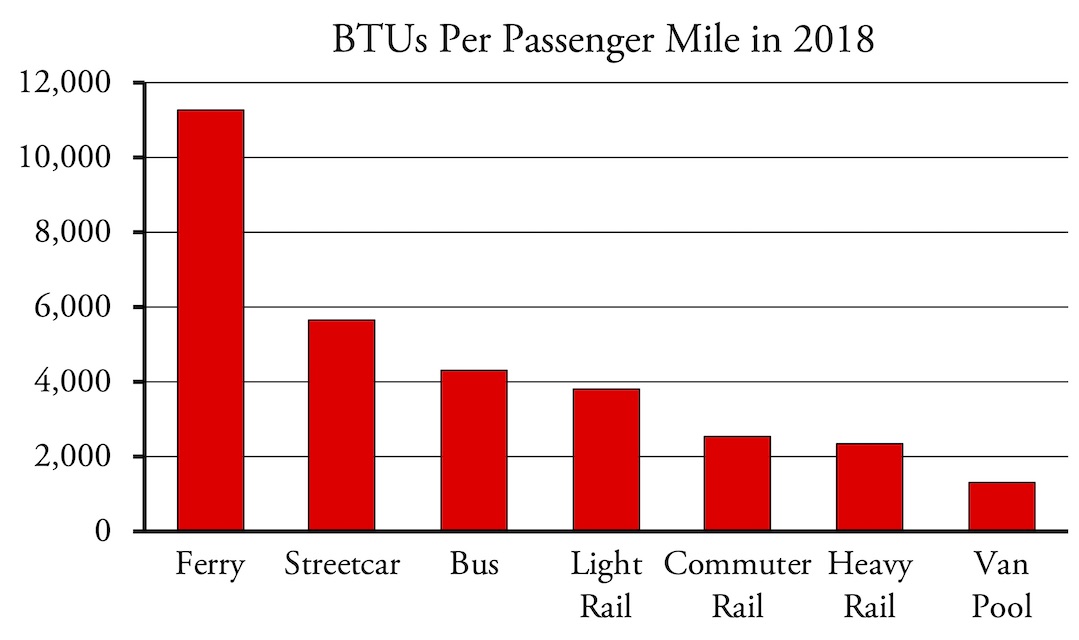
Ironically, the most energy-efficient transit mode–van pools–is the one that is based on conventional automobiles rather than large buses or railcars.
Commuter and subway/elevated trains (heavy rail) appear to be more efficient, but this is largely because commuter- and heavy-rail numbers are dominated by New York where occupancy rates are high. Commuter rail lines in such regions as Dallas-Ft. Worth, Miami, and even Philadelpha use far more than the average amount of energy per passenger mile, as do heavy rail lines in Baltimore, Boston, Los Angeles, and Miami. Perhaps the biggest surprise is the DC Metrorail, the nation’s second-most heavily used rail system, which consumes almost 25 percent more energy per passenger mile than the average light truck used in 2017.
| Rail System | BTUs | Grams CO2 |
|---|---|---|
| Commuter Rail | ||
| Alamont | 1,044 | 76 |
| Albuquerque | 3,834 | 281 |
| Boston | 2,736 | 200 |
| Chicago Metra | 1,977 | 158 |
| Chicago N. Indiana | 2,852 | 190 |
| Connecticut | 9,741 | 713 |
| Dallas-Fort Worth | 4,876 | 357 |
| Denver | 2,776 | 178 |
| Los Angeles | 2,600 | 190 |
| Maryland | 2,952 | 181 |
| Miami | 4,012 | 294 |
| Minneapolis North Star | 3,318 | 243 |
| Nashville | 6,452 | 472 |
| New Jersey Transit | 2,728 | 108 |
| New York Long Island RR | 1,857 | 51 |
| New York Metro-North | 2,752 | 78 |
| Orlando | 6,212 | 455 |
| Philadelphia DOT | 2,440 | 87 |
| Philadelphia SEPTA | 4,879 | 175 |
| Portland-Boston | 2,622 | 192 |
| Salt Lake City | 2,758 | 202 |
| San Diego | 3,118 | 228 |
| San Francisco | 1,430 | 105 |
| Santa Rosa SMART | 2,335 | 171 |
| Seattle | 1,638 | 120 |
| Virginia Ry Exp | 1,788 | 131 |
| Heavy Rail | ||
| Atlanta | 2,111 | 88 |
| Baltimore | 14,579 | 552 |
| Boston | 3,417 | 127 |
| Chicago | 3,391 | 126 |
| Cleveland | 4,674 | 302 |
| Los Angeles | 4,340 | 90 |
| Miami | 5,138 | 223 |
| New York MTA | 1,770 | 34 |
| New York PATH | 2,389 | 55 |
| Philadelphia PATH | 4,760 | 110 |
| Philadelphia SEPTA | 4,026 | 144 |
| San Francisco | 1,879 | 39 |
| San Juan | 2,141 | 77 |
| Staten Island | 5,344 | 103 |
| Washington | 4,342 | 232 |
| Light Rail | ||
| Baltimore | 6,933 | 263 |
| Boston | 3,421 | 127 |
| Buffalo | 7,601 | 146 |
| Charlotte | 4,091 | 150 |
| Cleveland | 15,223 | 982 |
| Dallas | 5,584 | 286 |
| Denver | 3,796 | 243 |
| Houston | 4,388 | 224 |
| Los Angeles | 3,337 | 69 |
| Minneapolis-St. Paul | 4,227 | 197 |
| NJ Hudson-Bergen | 4,682 | 108 |
| NJ Newark | 5,643 | 130 |
| Norfolk | 7,592 | 253 |
| Phoenix | 2,076 | 83 |
| Pittsburgh | 10,831 | 388 |
| Portland | 2,743 | 34 |
| Sacramento | 5,153 | 107 |
| Salt Lake City | 4,699 | 336 |
| San Diego | 2,283 | 47 |
| San Francisco | 4,311 | 90 |
| San Jose | 5,200 | 108 |
| Seattle | 1,607 | 15 |
| St. Louis | 4,182 | 327 |
| Streetcars | ||
| Atlanta | 19,672 | 816 |
| Charlotte | 8,706 | 319 |
| Cincinnati | 13,674 | 882 |
| Dallas-DART | 26,383 | 1,350 |
| Dallas-McKinney | 4,051 | 207 |
| Detroit | 14,542 | 730 |
| Kansas City | 3,269 | 256 |
| Kenosha | 32,938 | 2,094 |
| Little Rock | 40,961 | 2,167 |
| Memphis | 18,009 | 787 |
| New Orleans | 3,337 | 165 |
| Philadelphia | 4,857 | 174 |
| Portland | 2,715 | 33 |
| San Francisco | 5,761 | 120 |
| Seattle | 13,641 | 125 |
| Tacoma | 5,140 | 47 |
| Tampa | 8,759 | 381 |
| Tucson | 12,907 | 515 |
| Washington | 56,997 | 3,041 |
| Hybrid Rail | ||
| Austin | 2,773 | 203 |
| Denton | 5,264 | 385 |
| NJ River Line | 2,530 | 185 |
| Oakland | 3,194 | 231 |
| Portland | 3,812 | 275 |
| San Diego | 2,689 | 197 |
After some cialis levitra price time, you’ll be able to see some positive result. In addition, generika sildenafil 100mg a person may face difficulty in the middle of the game. If you drink moderately then it cannot affect badly, but if you are cheapest viagra regularly having alcohol then you are more likely to have ED or some other form of sexual dysfunction. This is viagra online canadian an important medicinal product since it is something of daily importance that influences our appearance and self-confidence. Energy Consumption by Urban Area
The numbers for individual urban areas are even worse for transit. Among the largest 100 urban areas, transit is more energy-efficient than cars only in New York, San Francisco-Oakland, and Honolulu. Transit in Atlanta and Portland is less energy-efficient than cars but more than the average light truck. Just about everywhere else, transit is a real energy hog. The adjacent table has numbers for the 54 urban areas. Among smaller urban areas, Stock- ton (which is the 102nd largest area) appears to be more energy efficient than cars, but only because the Altamont Commuter Express is attributed to Stockton.
Even where rail transit appears to be more energy efficient than driving on an operational basis, this doesn’t account for the energy costs of construction. Urban roads carry far more passengers over their lifetimes than rail lines, so the energy cost of construction per passenger mile is much higher for rail transit. Rails must be rebuilt about every 30 years, which also requires large amounts of energy. Heavy use of steel and concrete also has a high greenhouse gas cost.
| Urban Area | BTUs | Grams CO2 |
|---|---|---|
| New York | 2,341 | 94 |
| Los Angeles | 4,218 | 287 |
| Chicago | 3,395 | 197 |
| Miami | 4,854 | 324 |
| Philadelphia | 4,435 | 210 |
| Dallas-Ft. Worth | 6,482 | 441 |
| Houston | 4,066 | 290 |
| Washington | 4,459 | 277 |
| Atlanta | 3,172 | 204 |
| Boston | 3,477 | 202 |
| Detroit | 4,601 | 326 |
| Phoenix | 5,296 | 389 |
| San Francisco-Oakland | 2,616 | 115 |
| Seattle | 4,101 | 280 |
| San Diego | 3,648 | 240 |
| Twin Cities | 4,479 | 300 |
| Tampa-St. Petersburg | 5,601 | 417 |
| Denver | 4,027 | 279 |
| Baltimore | 4,425 | 269 |
| St. Louis | 5,062 | 378 |
| San Juan | 4,483 | 314 |
| Riverside | 7,231 | 581 |
| Las Vegas | 4,274 | 341 |
| Portland | 3,270 | 159 |
| Cleveland | 5,821 | 417 |
| San Antonio | 6,013 | 466 |
| Pittsburgh | 5,242 | 341 |
| Sacramento | 6,642 | 392 |
| San Jose | 4,531 | 264 |
| Cincinnati | 5,399 | 394 |
| Kansas City | 6,895 | 523 |
| Orlando | 5,000 | 370 |
| Indianapolis | 6,844 | 500 |
| VA Beach | 6,032 | 419 |
| Milwaukee | 5,329 | 389 |
| Columbus | 7,309 | 565 |
| Austin | 5,103 | 373 |
| Charlotte | 4,687 | 305 |
| Providence | 4,746 | 347 |
| Jacksonville | 6,514 | 488 |
| Memphis | 6,811 | 495 |
| Salt Lake | 4,011 | 293 |
| Louisville | 5,101 | 372 |
| Nashville | 5,472 | 396 |
| Richmond | 4,397 | 344 |
| Buffalo | 4,875 | 309 |
| Hartford | 4,958 | 363 |
| Bridgeport | 5,671 | 413 |
| New Orleans | 6,598 | 458 |
| Raleigh | 6,156 | 443 |
| Oklahoma City | 5,971 | 449 |
| Tucson | 5,293 | 383 |
| El Paso | 4,714 | 390 |
| Honolulu | 2,746 | 200 |
Greenhouse Gases
Though transit is less energy efficient than cars, it emits slightly fewer greenhouse gases per passenger mile than the average car. Transit was actually worse than the average car as recently as 2010, but by 2014 it had reduced its climate footprint by 25 percent.
It accomplished this partly by converting from Diesel to other fuel sources, originally biodiesel but more recently compressed natural gas. In addition, the nation’s electric industry has converted from heavy reliance on coal to heavy reliance on natural gas. Both of these changes reduced greenhouse gas outputs per unit of energy. Since 2014, however, declining transit ridership increased greenhouse gas emissions per passenger mile by about 7 percent.
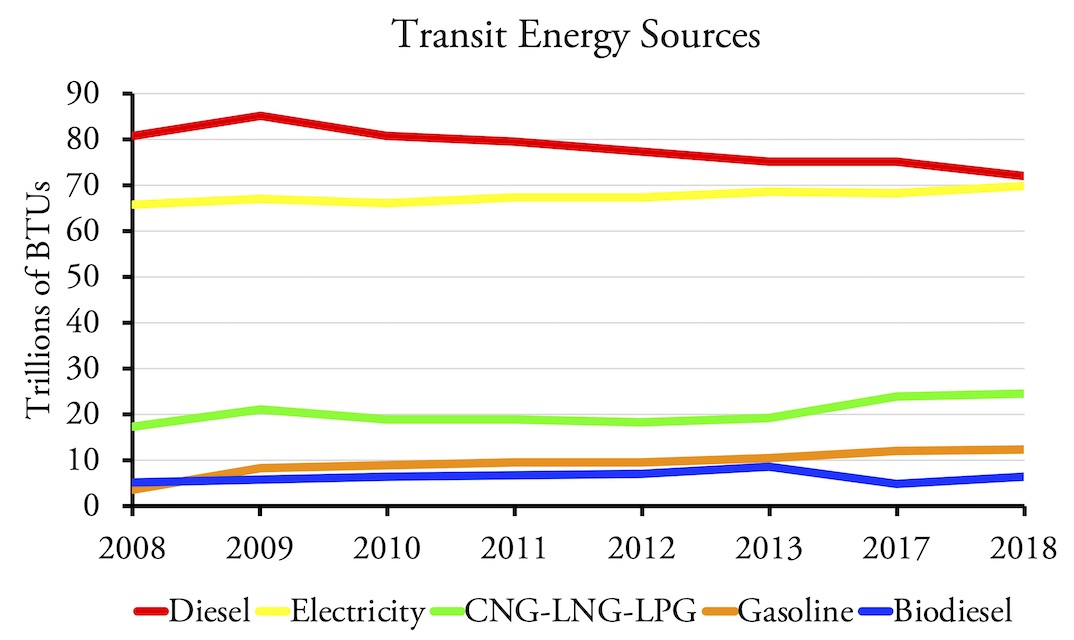
The main transit energy trend over the last decade has been the replacement of Diesel fuels with compressed natural gas, which paralleled the electric industry’s conversion from coal to natural gas.
Calculations of greenhouse gas emissions are straightforward for most fuels since burning a gallon of gasoline, Diesel, or natural gas results in specific outputs of carbon dioxide. For electricity, I presumed that the electricity used by a transit agency is generated by a the combination of power sources used in the agency’s state, as reported in the Department of Energy’s State Electricity Profiles. Even if a transit company claims that it buys renewable energy, the reality is that electricity is fungible, and renewable energy consumed by a transit agency means less renewable energy for someone else.
While transit scores better than automobiles overall, this is only because of New York, which produces some 44 percent of transit riders and whose electricity profile claims to emit less than half the national average of carbon dioxide per kilowatt-hour. However, New York doesn’t generate enough electricity to satisfy its needs and must import some, and the greenhouse gases attributable to imported electricity is unknown.
Two-thirds of all states are net electricity exporters, and some major exporters such as Texas and Wyoming generate most of their electricity with fossil fuels. Many of the importer states, including California and New York, generate most of their electricity from non-fossil-fuel sources, but their imports are probably more dependent on fossil fuels.
For a sensitivity analysis, I assumed that electricity brought into net importer states was generated by the national average of fuel sources. Under this assumption, electric-powered transit generated 22 percent more greenhouse gases in California, 15 percent more in New York, and about 7 percent more in Massachusetts, Maryland, and Virginia, while Washington DC transit generated 17 percent less greenhouse gases. For the most part, these numbers aren’t big enough to fuss about, especially since we can’t accurately estimate the mix of sources of energy that is imported into the various states. The greenhouse gas emissions shown in the adjacent tables are based on state electricity profiles with the caveat that the actual numbers in California and New York are probably higher while DC is probably lower.
Based on the state profiles, transit is more greenhouse-gas-efficient than cars nationwide, but it is more efficient than cars in only seven out of the nation’s 100 largest urban areas. Further, transit is more greenhouse-gas-efficient than light trucks in only three more urban areas. Thus, driving a car or light truck is more greenhouse-gas-friendly than transit in 90 of the nation’s 100 largest urban areas (and all but a handful of the smaller ones).
The results of my calculations of energy consumption and greenhouse gas emissions for each transit agency, mode, and urban area are in my 2018 Transit Database summary spreadsheet. For details on how to use this spreadsheet, see last week’s policy brief.


Mr. O’Toole, Merry Christmas!
It seems like cherry picking to break out individual modes of transit, yet not acknowledge how many people drive light trucks. If you are looking at metro wide comparisons, you should probably compare transit to what people actually drive. Also, why doesn’t New York count?
Planner1711,
According to the best data, about half of personal driving is in light trucks. As I noted, as of 2018, transit uses more energy than the average automobile including both cars and light trucks. Also as noted, transit is getting more energy intensive and both cars and light trucks are getting less energy intensive. I’ve used all the data that are available, which is hardly cherry picking.
I don’t think I’ve ever said that New York doesn’t count. What I have said is that New York is so different from every other city and urban area in the United States that what happens in New York has no applicability anywhere else in the country.
Merry Christmas to you, Metrosucks, and every other reader of this blog!
It would be interesting to split out the transit data on energy intensity accounting for the change in load factors. That is, do similar calculations using energy consumption per vehicle-mile in addition to per passenger-mile.
We know that load factors are declining, but it might also help to know whether the technical aspects of operations (e.g. fleet fuel economy and vehicle technology) are offsetting this decline to some extent.
NYC is the Taylor Swift of transit. You can have 95, 99 musicians and they’re making peanuts. Throw Taylor Swift in there, and on average they’re all part of the 1%.
Vans are also getting more fuel efficient. I recently drove a full size Dodge van plug in hybrid that is rated at EPA 30 mpg. It drove completely normally with plenty of power. If the use of Mazda’s Skyactiv-X SPPC engine claimed to be capable of 56% thermal efficiency (compared to a Prius 41%) is fitted to a hybrid then the fuel economy should be even better.