Today marks 50 years of my work in public policy analysis. I began in June 1972 as an intern for the Oregon Student Public Interest Research Group. By July, I had written a lengthy paper on how Portland should make transportation improvements to reduce air pollution. Since then, I’ve written somewhere around 200 more papers, several books, and numerous op-eds and articles on topics ranging from endangered species to high-speed rail in geographic areas ranging from Georgia to Tasmania.
I started writing the Antiplanner in January, 2007, and have since written more than 3,700 posts, including 150 policy briefs. That’s enough; it’s time for me to retire. This is difficult because I feel I still have some unfinished business.
The first half of my career was helping environmentalists protect natural resources from corporations that wanted government subsidies to do harm to the environment. After two decades, I left the environmental movement when they began supporting government subsidies to corporations to do harm to the environment. Continue reading
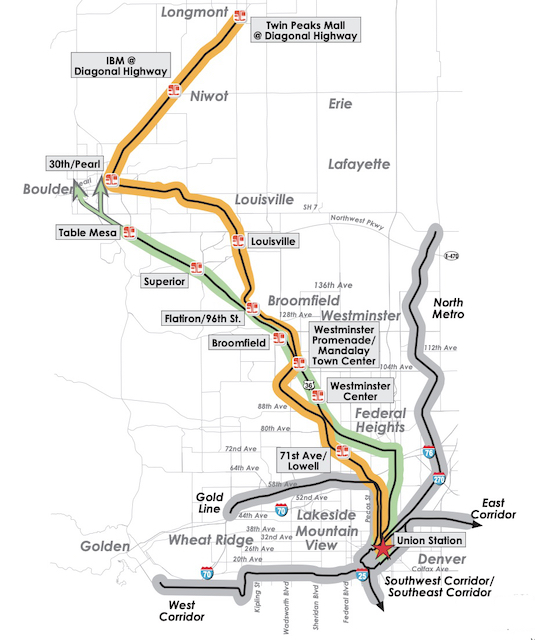 The green line is the existing bus-rapid transit line while the circuitous orange line is the proposed rail route to Longmont. The thick grey lines are other rail transit routes that are nearly all in service today. If Longmont were really a worthwhile destination, the logical thing for RTD to do is extend the bus-rapid transit line to Longmont. But Longmont officials were promised a train and they demand to have a train.