Search Results for: plan bay area

The Law of Large Proportions Saves Energy

Americans drove more miles in 2019 than the previous year but used less energy to do so, according to data released by the Department of Energy last week. This isn’t a new trend: American energy consumption for highway passenger vehicles has declined 12 percent since 2007 despite the fact that we are driving 7 percent more miles.
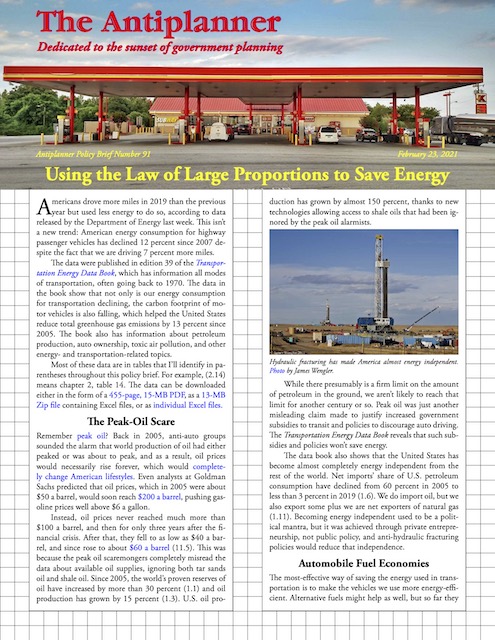
Click image to download a four-page PDF of this policy brief.

The data were published in edition 39 of the Transportation Energy Data Book, which has information all modes of transportation, often going back to 1970. The data in the book show that not only is our energy consumption for transportation declining, the carbon footprint of motor vehicles is also falling, which helped the United States reduce total greenhouse gas emissions by 13 percent since 2005. The book also has information about petroleum production around the world, auto ownership for many other countries, toxic air pollution, and other energy- and transportation-related topics. Continue reading

How Much Is a Trillion Dollars?

In 1939, the federal budget was $9 billion, the most in peacetime history. The year before, when looking at the proposed budget, a young congressman named Everett Dirksen was quoted by the New York Times as saying, “a billion here, a billion there, and by and by it begins to mount up into money.” (Later, someone amended the quote to “real money,” which has a greater effect in print, but probably wasn’t necessary when spoken in Dirksen’s baritone voice.)

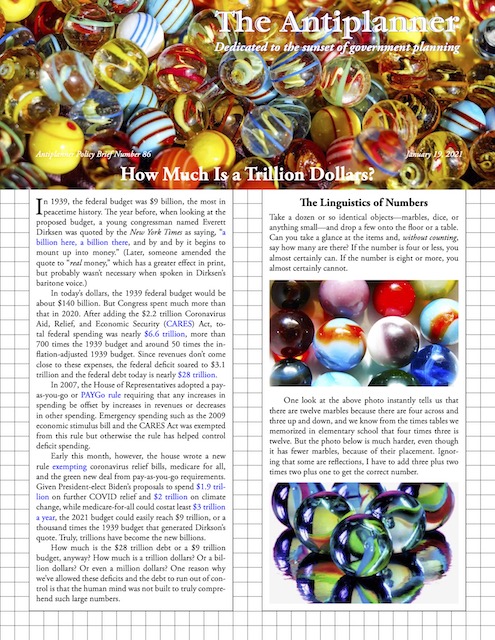
Click image to download a four-page PDF of this policy brief.

In today’s dollars, the 1939 federal budget would be about $140 billion. But Congress spent much more than that in 2020. After adding the $2.2 trillion Coronavirus Aid, Relief, and Economic Security (CARES) Act, total federal spending was nearly $6.6 trillion, more than 700 times the 1939 budget and around 50 times the inflation-adjusted 1939 budget. Since revenues don’t come close to these expenses, the federal deficit soared to $3.1 trillion and the federal debt today is nearly $28 trillion. Continue reading

Idaho Is Roaring

“Had someone asked me in March,” wrote economist Megan McArdle in September, “I would have predicted that after six months of pandemic, the housing market would be full of panicked people frozen in their homes, except for those who were being evicted. Instead, the housing market is roaring.”

It continues to roar today. As the Economist observes, those roars are fed by low interest rates, government cash handouts, and a desire of many to move to homes suitable for telecommuting.

Of course, some housing markets are roaring louder than others. As CNN notes, “home prices are rising faster in the middle of the U.S. as Covid drives people away from coasts.” CNN cites home price index data published by the Federal Housing Finance Administration. Continue reading

Transit: Browner Than Ever

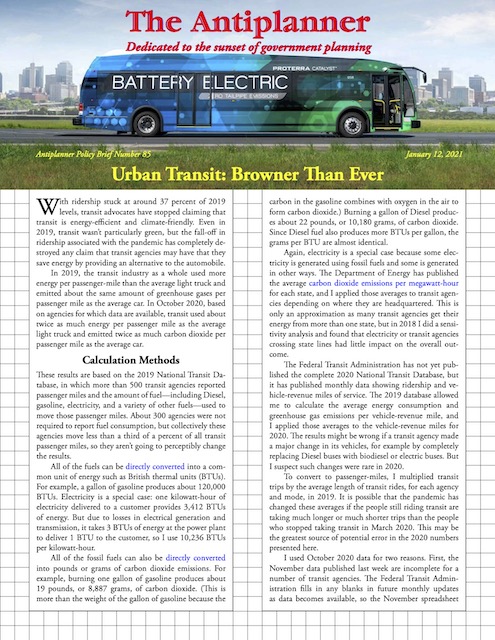
With ridership stuck at around 37 percent of 2019 levels, transit advocates have stopped claiming that transit is energy-efficient and climate-friendly. Even in 2019, transit wasn’t particularly green, but the fall-off in ridership associated with the pandemic has completely destroyed any claim that transit agencies may have that they save energy by providing an alternative to the automobile.

Click image to download a four-page PDF of this policy brief.

In 2019, the transit industry as a whole used more energy per passenger-mile than the average light truck and emitted about the same amount of greenhouse gases per passenger mile as the average car. In October 2020, based on agencies for which data are available, transit used about twice as much energy per passenger mile as the average light truck and emitted twice as much carbon dioxide per passenger mile as the average car. Continue reading

Supercommuting and Marchetti’s Constant

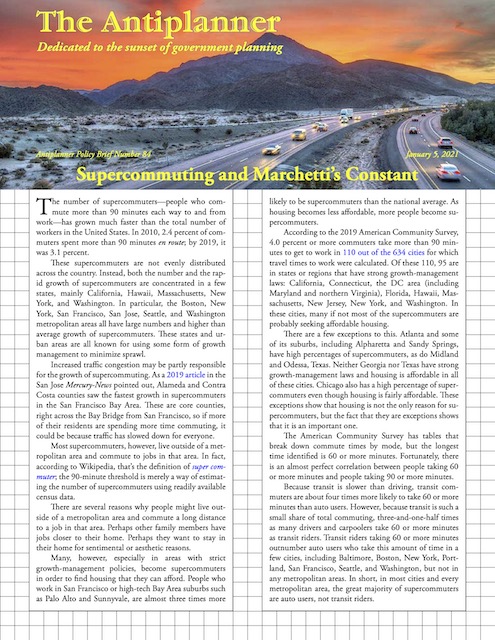
The number of supercommuters–people who commute more than 90 minutes each way to and from work–has grown much faster than the total number of workers in the United States. In 2010, 2.4 percent of commuters spent more than 90 minutes en route; by 2019, it was 3.1 percent.

Click image to download a four-page PDF of this policy brief.

These supercommuters are not evenly distributed across the country. Instead, both the number and the rapid growth of supercommuters are concentrated in a few states, mainly California, Hawaii, Massachusetts, New York, and Washington. In particular, the Boston, New York, San Francisco, San Jose, Seattle, and Washington metropolitan areas all have large numbers and higher than average growth of supercommuters. These states and urban areas are all known for using some form of growth management to minimize sprawl. Continue reading

October Ridership Still Just 37% of 2019

Transit ridership in October 2020 was just 37.1 percent of October 2019 numbers, according to data posted Friday by the Federal Transit Administration. This is only a tiny improvement from September, when ridership was 36.9 percent of September 2019.

Despite the huge decline in ridership, transit agencies are still maintaining service at 75 percent of 2019 levels. Transit in the New York urban area, where ridership is down 62.4 percent, is running at 85 percent of 2019 levels. Agencies say they are doing this to allow for “social distancing,” but it is more likely that they are spending the money to keep union workers employed and to justify their parasitical existence.

Among major urban areas, the biggest change is in the San Francisco Bay Area, where ridership is just 23 percent of 2019 levels. At 25 percent, Washington is second followed by Boston, Sacramento, and San Jose, all of which are around 30 percent. Continue reading

How Transit Subsidies Harm Poor People

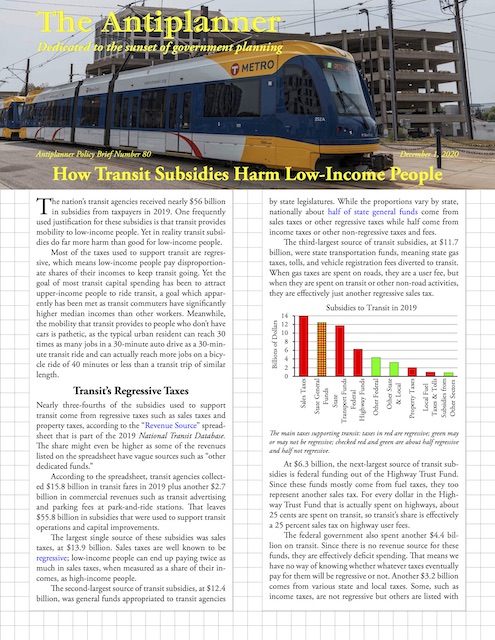
The nation’s transit agencies received nearly $56 billion in subsidies from taxpayers in 2019. One frequently used justification for these subsidies is that transit provides mobility to low-income people. Yet in reality transit subsidies do far more harm than good for low-income people.

Click image to download a four-page PDF of this policy brief.

Most of the taxes used to support transit are regressive, which means low-income people pay disproportionate shares of their incomes to keep transit going. Yet the goal of most transit capital spending has been to attract upper-income people to ride transit, a goal which apparently has been met as transit commuters have significantly higher median incomes than other workers. Meanwhile, the mobility that transit provides to people who don’t have cars is pathetic, as the typical urban resident can reach 30 times as many jobs in a 30-minute auto drive as a 30-minute transit ride and can actually reach more jobs on a bicycle ride of 40 minutes or less than a transit trip of similar length. Continue reading

Portland Wises Up

Austin voters apparently approved the cities foolish $7 billion light-rail plan. San Francisco Bay Area voters apparently approved a regressive tax-increase to support high-income riders of the Caltrain commuter train. But Portland voters have apparently rejected a $5 billion transportation measure that was mainly aimed at building the region’s most-expensive light-rail line yet.

Portland’s rejection of light rail is not too surprising as the region has rejected every transit tax measure that’s been on the ballot since 1996 because voters have learned that light rail costs too much and does too little. Too bad Austin couldn’t have learned from Portland’s experience.

Portland voters also appear to have returned centrist Ted Wheeler to the mayor’s office even though polls showed he was running well behind leftist challenger Sarah Iannarone. Wheeler had earned the ire of Black Lives Matter protesters when he didn’t try to stop police from stopping property destruction in downtown Portland. Iannarone, meanwhile, openly supported antifa violence and wore clothing celebrating Chairman Mao. Continue reading

BLM: Following the Money

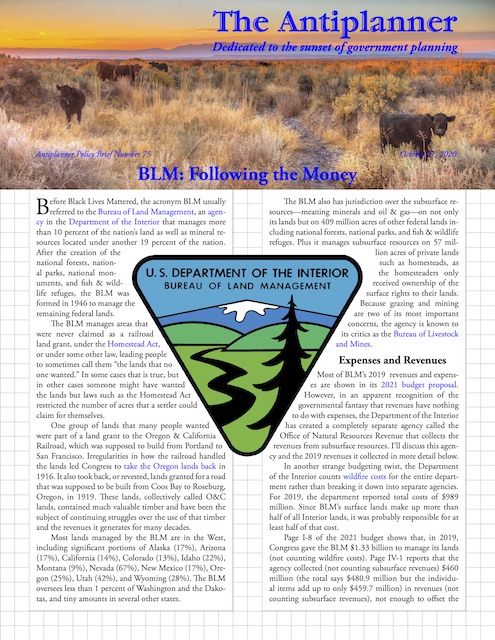
Before Black Lives Mattered, the acronym BLM usually referred to the Bureau of Land Management, an agency in the Department of the Interior that manages more than 10 percent of the nation’s land as well as mineral resources located under another 19 percent of the nation. After the creation of the national forests, national parks, national monuments, and fish & wildlife refuges, the BLM was formed in 1946 to manage the remaining federal lands.

Click image to download a four-page PDF of this policy brief.

The BLM manages areas that were never claimed as a railroad land grant, under the Homestead Act, or under some other law, leading people to sometimes call them “the lands that no one wanted.” In some cases that is true, but in other cases someone might have wanted the lands but laws such as the Homestead Act restricted the number of acres that a settler could claim for themselves. Continue reading

Telling Clients What They Want to Hear

The Washington State Transportation Commission hired the Boston Consulting Group to develop a “sustainable growth vision” for the Cascadia Corridor, which means Vancouver, BC to Portland, Oregon. The Boston Group did taxpayers a disservice by telling the commission what it wanted to hear, rather than what it needed to know.

The group observed that the cities in the corridor have the opportunity to become “a global innovation hub.” To find out how to do that, the Bostonians looked at other major innovation hubs and discovered they fall into two rather distinct groups that it called “affordable sprawl” and “expensive and congested.” The best representative of the former is the Texas Triangle, meaning Dallas-Houston-San Antonio. The best representative of the latter is the San Francisco Bay Area.

When measured on two axes of housing affordability and a rush-hour congestion, the Texas Triangle is high on affordability and low on congestion, while the Bay Area is low on affordability and high on congestion. The Bostonians noted that the Cascadia Corridor is currently right in the middle on both, but warned that if it wasn’t careful it would end up as bad or even worse off than the Bay Area. Continue reading