Cars Still More Energy Efficient Than Transit

The average car used less than 2,800 British thermal units (BTUs) of energy per passenger-mile in 2019, according to the latest edition of the Department of Energy’s Transportation Energy Data Book. This is nearly a 25 percent improvement since 1999. It also made cars more energy efficient than transit in every urban area in the country except New York and San Francisco.
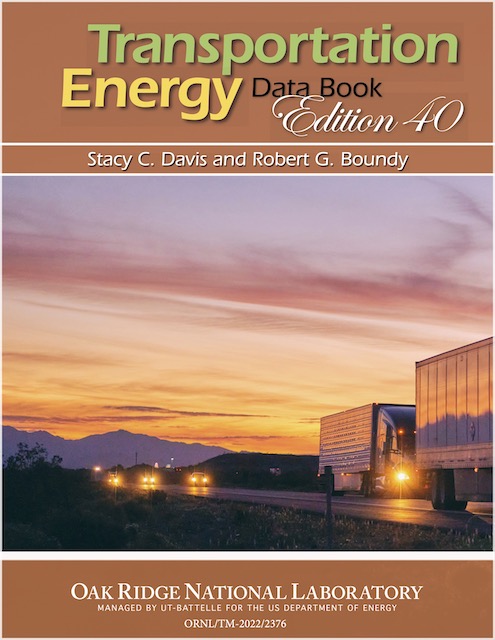
Click image to download a 16.4-MB PDF of this report. Click here to download Excel spreadsheets for the 361 tables in the report (11 MB).

The Department of Energy releases its annual update to the data book every February, but I wasn’t paying attention when the last one came out. In fact, it doesn’t say a lot that’s new since the previous one was issued in 2021, but it shows that both autos and airplanes continue to improve their energy efficiencies, the latter by 42 percent since 1999. Continue reading

The Vice of Making Losses

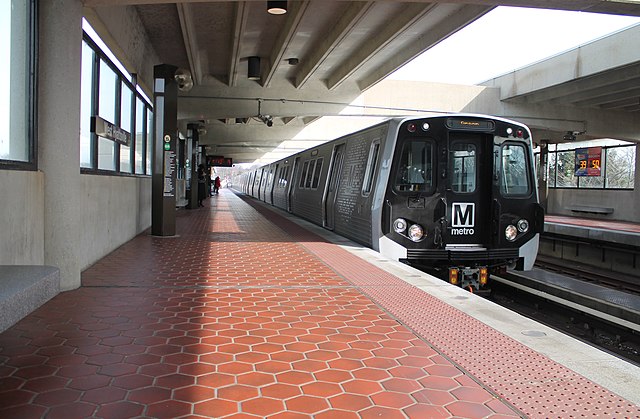
A recent staff presentation to the Washington Metro board’s finance committee revealed that the agency is expecting to run out of federal COVID relief funds in 2024 and anticipates a $187.5 million shortfall in funding that year. From then on, it anticipates funding shortfalls of more than $500 million a year, rising to more than $700 million by 2030.

With half of DC employees working at home, Washington Metro trains have been running nearly empty since the pandemic began. Photo by Elvert Barnes.

That’s if ridership recovers to 100 percent of pre-pandemic levels. If only 75 percent of riders return, shortfalls will range from more than $700 million in 2025 to more than $900 million in 2030. In fact, as of July, ridership was still less than 50 percent of pre-pandemic numbers. Continue reading

Comments from Colorado

The Denver/Colorado Springs Gazette has published two articles by the Antiplanner highlighting problems with transportation planning in Denver and nationwide. The first, dated September 11, argues that cities have lost the war on cars. In particular, Denver has been reducing roadway capacities and spending billions on transit, yet driving keeps growing. A follow-up editorial by the newspaper agrees.

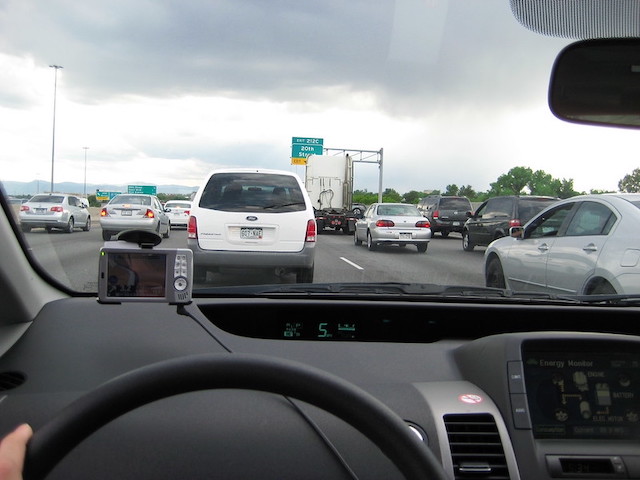
Stuck in traffic in Denver, thanks to local and regional transportation planners. Photo by Adrian Black.

More recently, an op-ed by the Antiplanner argues that the pandemic has changed Colorado transportation for good, yet transportation planners still plan for a pre-pandemic world. The number of people working at home in the Denver urban area tripled between 2019 and 2021, which devastated transit ridership yet led to an 8 percent increase in driving as people working at home run errands and take other auto trips they weren’t taking when confined to an office. Continue reading

U.S. Not Running Short of Land

Alert the FBI! Someone has stolen and hidden away most of the land in the United States. At least, that’s the message I get from a recent Wall Street Journal article that claims that “the U.S. is running short of land for housing.”

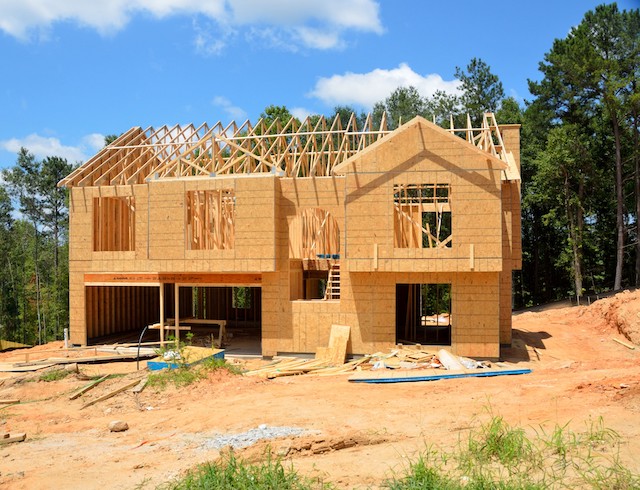
More than 600,000 acres of land like this can be found outside of San Jose. It isn’t prime farm land, nor is it too steep to build on. Yet San Jose has some of the most expensive housing in America because almost no one can see that this land is available for housing.

According to a 2017 land inventory by the Department of Agriculture, the contiguous 48 states have about 1.9 billion acres of land. Of these, about 116 million have been developed (including rural developments such as roads and railroads). Another 406 million acres are federal. The USDA doesn’t say so, but about 70 million acres are state land. An unknown number are county or city lands, but it is probably under 50 million acres. Continue reading

The Future of Urban Work

Between 40 and 50 percent of workers in 13 American cities telecommuted in 2021, according to the recently released American Community Survey (discussed here previously). The record is Fremont, California (outside of Oakland), where 48.9 percent telecommuted. More notable, three — possibly four, depending on how you count* — of the 13 cities are central cities, including San Francisco, Seattle, and Washington.

CityStateTelecommuters2021 JobsChange from 2019Change in Transit CommutersChange in Drive Alone Commuting
FremontCA48.9%112,50824,873-81.6%-17.9%
ArlingtonVA48.8%142,653-6,747-79.2%-34.2%
WashingtonDC48.3%353,845-32,033-68.8%-28.9%
BellevueWA48.1%74,006-6,368-80.3%-37.5%
SunnyvaleCA47.1%81,435-3,936-68.0%-45.9%
SeattleWA46.8%438,357-23,131-75.8%-30.8%
BerkeleyCA46.5%57,877-3,989-84.4%-16.5%
San FranciscoCA45.6%438,886-87,136-73.9%-22.8%
CambridgeMA44.4%70,450-816-58.9%-31.4%
CaryNC44.2%91,3932,32037.3%-34.2%
NewtonMA43.9%45,504-579-68.9%-36.0%
BoulderCO42.6%55,376-3,192-72.5%-28.9%
Santa ClaraCA40.2%68,880-6,756-80.1%-42.9%

Most of these 13 cities saw 70 percent or more declines in transit commuters since 2019. The major exception was Cary, North Carolina. However, the survey numbers for Cary are questionable. Transit’s share of Cary workers went from 0.3 to 0.4 percent. Because these numbers are so small, the margins of error are large. The Census Bureau reported 295 plus or minus 233 transit commuters in 2019 and 405 plus or minus 348 in 2021. Since the error terms overlap, the change from 2019 to 2021 isn’t statistically significant. Continue reading

Is Wall Street Making Housing Unaffordable?

“Wall Street is snapping up [single-] family homes,” reports the Economist. This isn’t exactly news. A year ago, CNN reported the same thing. Two years ago, the New York Times reported a “$60 billion housing grab by Wall Street.” Three years ago, the Atlantic announced that “Wall Street is your landlord.”

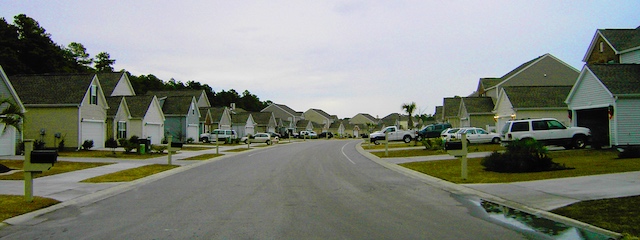
Wall Street’s or your street? Photo by isipeoria.

These articles are often accompanied by an implicit accusation that Wall Street speculators are responsible for housing becoming unaffordable. Sometimes the accusation is more explicit. A year ago, Tucker Carlson claimed that the “phenomenon of skyrocketing house prices is being driven by Wall Street outbidding normal Americans trying to buy homes.” Earlier this week, HousingWire.com claimed that “Institutional purchases are . . . making houses less affordable.” Continue reading

Pandemic Increases Homeownership

The nation’s number of occupied homes grew by 3.9 percent between 2019 and 2021, representing 4.7 million units of new homes, according to table B25032 of the American Community Survey. More than 98.5 percent of those new units were owner occupied, while rental housing grew by just 0.2 percent or less than 1.5 percent of total new homes.

More than three-fourths of new homes were single-family detached homes, reflecting the preferences of most (about 80 percent) Americans for such homes. Another 16 percent were single-family attached (row houses), while only 12 percent were multifamily. Continue reading

July Driving Falls to 97% of Pre-Pandemic Levels

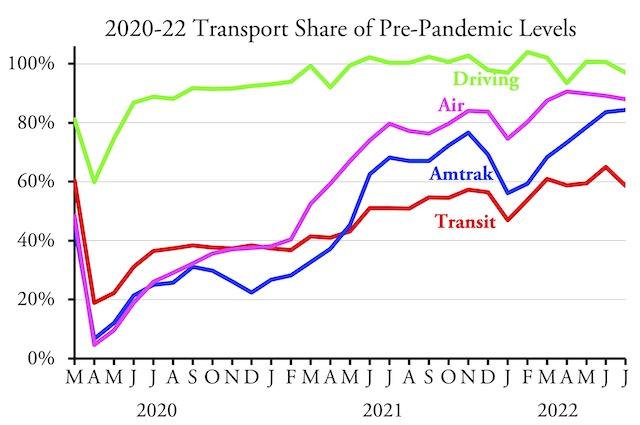
Americans drove 97 percent as many miles in July 2022 as they had in July 2019, the year before the pandemic, according to data released yesterday by the Federal Highway Administration. This is only the fourth month out of the last fourteen in which driving was less than 100 percent of pre-pandemic levels.

See this post for sources of data for Amtrak, air travel, and transit.

The dip in driving in April was explainable by the spike in fuel prices caused by the war in Ukraine. Prices actually peaked in mid-June and have declined almost every day since, so it isn’t clear why driving declined a bit in July. Continue reading

Population and Housing in 2021

The 2021 American Community Survey confirms that major population shifts took place due to the pandemic. But those shifts aren’t necessarily reflected by declines in housing prices in cities and regions that lost population. Indeed, prices rose almost everywhere, and usually faster than incomes.

Americans are moving out of big cities to smaller towns and the suburbs, but so far this hasn’t made big-city housing more affordable.

Numerically, the big loser between 2019 and 2021 was California, which saw the net departure of almost 275,000 people. That was just 0.7 percent of the state’s population, but the only state that lost a greater percentage was Mississippi. Other states that lost residents were Arizona, Louisiana, and West Virginia, plus the District of Columbia lost more than 25,000 people, or more than 5 percent of its population. Continue reading

Census Data Show Transit’s Devastation

More than three times as many people worked at home in 2021 as in 2019, according to data that was released yesterday by the Census Bureau. While this isn’t surprising, the increase in telecommuting had an outsized impact on transit commuting, which declined by more than 50 percent. For comparison, the number of people driving alone to work declined by only 12 percent.

These numbers are from the American Community Survey, a questionnaire that the Census Bureau has sent to about 3.5 million households each year since 2005. Due to the pandemic, the Census Bureau did not do a complete survey in 2020. However, 2021 data are directly comparable to 2019 numbers to get an indication of changes due to the pandemic.

The survey produces more than 1,500 tables about population, race, incomes, housing, commuting, education, and other information. Today, I’ll focus on tables B08103, “Means of Transportation to Work,” B08119, “Means of Transportation to Work by Workers’ Earnings in the Past 12 Months,” B08141, “Means of Transportation to Work by Vehicles in Household,” and B25044, “Tenure by Vehicles in Household.” I’ll write about other tables in future posts. Continue reading