Search Results for: jarrett walker

49. Romance of the Rails

Shortly before the Cato Institute published Gridlock, Knopf published a similar book called Traffic by a writer named Tom Vanderbilt. The two didn’t cover exactly the same ground: Traffic focused on the physics of congestion while Gridlock focused on the institutional issues around transportation. But I noticed that Traffic received far more reviews and mentions in major newspapers and magazines than Gridlock.

American Nightmare, my next book, got even less attention. Part of the problem, I was told, was that book reviewers didn’t take Cato seriously as a publisher. I wanted to change that, so I asked Cato’s book editor, John Samples, and Cato’s marketing director, Bob Garber, how I should write a book that would sell better.

“Tell stories,” they said. People like stories. Gridlock and American Nightmare both delved deep into history, the latter going back a thousand years to look at housing and property rights. But the stories these books told were impersonal. Continue reading

Transit’s Dim Future

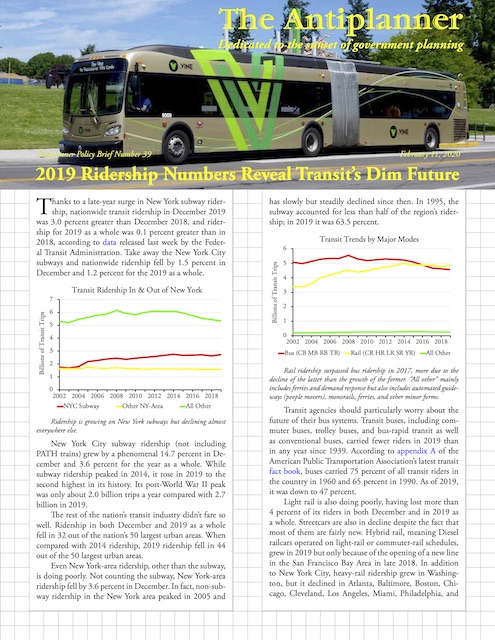
Thanks to a late-year surge in New York subway ridership, nationwide transit ridership in December 2019 was 3.0 percent greater than December 2018, and ridership for 2019 as a whole was 0.1 percent greater than in 2018, according to data released last week by the Federal Transit Administration. Take away the New York City subways and nationwide ridership fell by 1.5 percent in December and 1.2 percent for the 2019 as a whole.

Click image to download a five-page PDF of this policy brief.

New York City subway ridership (not including PATH trains) grew by a phenomenal 14.7 percent in December and 3.6 percent for the year as a whole. While subway ridership peaked in 2014, it rose in 2019 to the second highest in its history. Its post-World War II peak was only about 2.0 billion trips a year compared with 2.7 billion in 2019. Continue reading

Reducing Mobility to Boost Transit

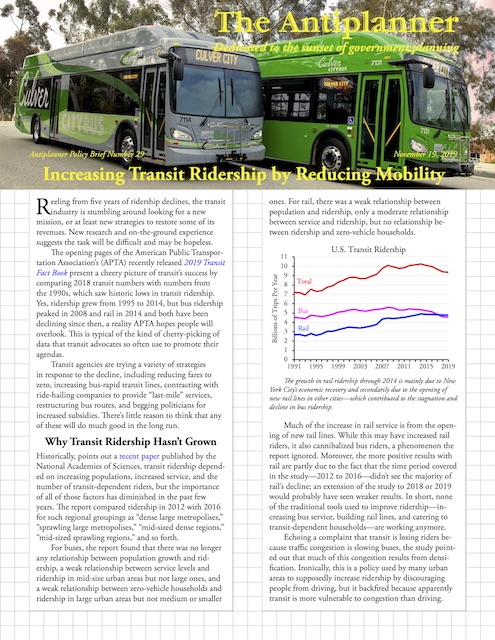
Reeling from five years of ridership declines, the transit industry is stumbling around looking for a new mission, or at least new strategies to restore some of its revenues. New research and on-the-ground experience suggests the task will be difficult and may be hopeless.

Click image to download a four-page PDF of this policy brief.

The opening pages of the American Public Transportation Association’s (APTA) recently released 2019 Transit Fact Book present a cheery picture of transit’s success by comparing 2018 transit numbers with numbers from the 1990s, which saw historic lows in transit ridership. Yes, ridership grew from 1995 to 2014, but bus ridership peaked in 2008 and rail in 2014 and both have been declining since then, a reality APTA hopes people will overlook. This is typical of the kind of cherry-picking of data that transit advocates so often use to promote their agendas. Continue reading

August Ridership Drops in 40 of Top 50 Regions

August 2019 transit ridership in the New York urban area grew a massive 5.1 percent above the same month in 2018, according to National Transit data released last Thursday by the Federal Transit Administration. That was enough to push nationwide transit ridership up, but only by 0.3 percent. Not counting New York, transit ridership fell by 3.2 percent.

August ridership fell in Phoenix by 16.2 percent, which may have been due to the weather: temperatures rose about 105 degrees for 21 days in August 2019, vs. just nine days in August 2018. Ridership also fell by 16.6 percent in Louisville, 14.1 percent in New Orleans, and 11.2 percent in Virginia Beach-Norfolk.

While these were the extremes, few major urban areas were exempt from the decline. Ridership dropped in Seattle (-2.6%) and Houston (-1.1%), both regions that had been once claimed to be exempt from the malaise that is affecting the nation’s transit industry. Ridership grew in only 10 of the nation’s 50 largest urban areas, and one of those — Dallas-Ft. Worth — is suspect as nearly all of the growth is in Dallas buses, which installed a new way of counting riders last fall that reports much higher numbers than before. Continue reading

Ridership Falls Another 2.9 Percent in June

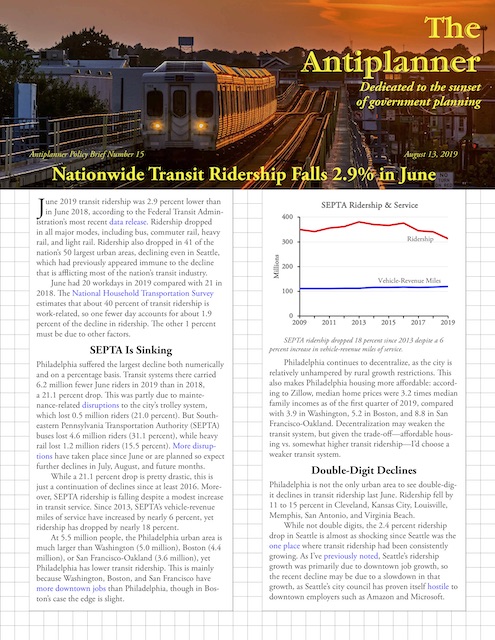
June 2019 transit ridership was 2.9 percent lower than in June 2018, according to the Federal Transit Administration’s most recent data release. Ridership dropped in all major modes, including bus, commuter rail, heavy rail, and light rail. Ridership also dropped in 41 of the nation’s 50 largest urban areas, declining even in Seattle, which had previously appeared immune to the decline that is afflicting most of the nation’s transit industry.

Click image to download a three-page PDF of this policy brief.

June had 20 workdays in 2019 compared with 21 in 2018. The National Household Transportation Survey estimates that about 40 percent of transit ridership is work-related, so one fewer day accounts for about 1.9 percent of the decline in ridership. So at least a third of the decline must be due to other factors. Continue reading

10. Los Angeles Metro’s New Climate Strategy

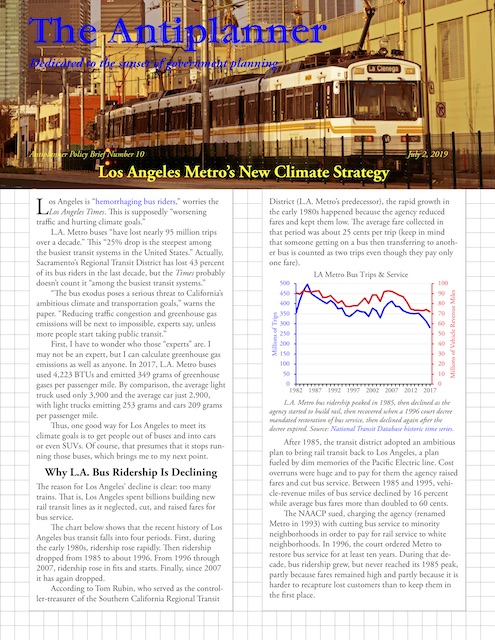
Los Angeles is “hemorrhaging bus riders,” worries the Los Angeles Times. This is supposedly “worsening traffic and hurting climate goals.”

Click image to download a PDF of this policy brief.

L.A. Metro buses “have lost nearly 95 million trips over a decade,” the paper notes. This “25% drop is the steepest among the busiest transit systems in the United States.” Actually, Sacramento’s Regional Transit District has lost 43 percent of its bus riders in the last decade, but the Times probably doesn’t count it “among the busiest transit systems.” Continue reading

7. April Transit Ridership Grows 2%

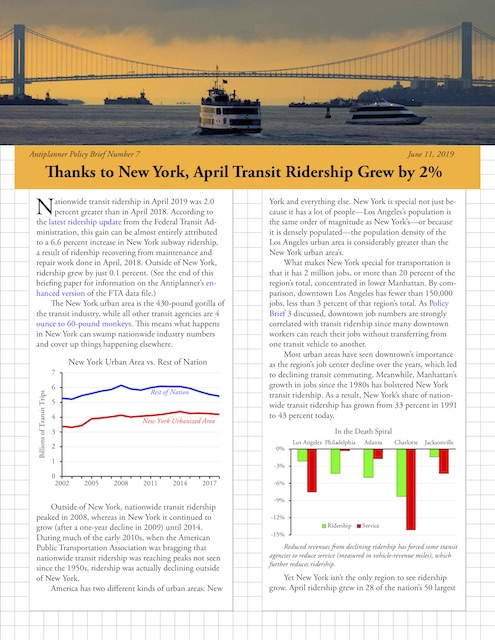
Nationwide transit ridership in April 2019 was 2.0 percent greater than in April 2018. According to the latest ridership update from the Federal Transit Administration, this gain can be almost entirely attributed to a 6.6 percent increase in New York subway ridership, a result of ridership recovering from maintenance and repair work done in April, 2018. (See the end of this post for information on the Antiplanner’s enhanced version of the FTA data file.)

Click image to download a three-page PDF of this policy brief.

The New York urban area is the 430-pound gorilla of the transit industry, while all other transit agencies are 4 ounce to 60-pound monkeys. This means what happens in New York can swamp nationwide industry numbers and cover up things happening elsewhere. Continue reading

5. DOT Data Reveals Transit’s Irrelevance

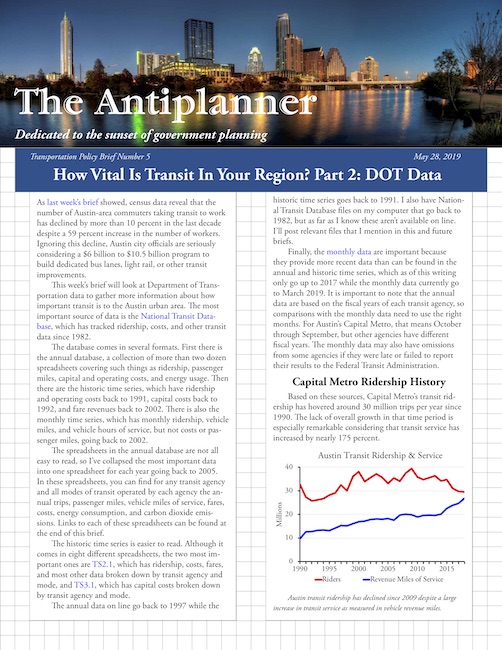
As last week’s brief showed, census data reveal that the number of Austin-area commuters taking transit to work has declined by more than 10 percent in the last decade despite a 59 percent increase in the number of workers. Ignoring this decline, Austin city officials are seriously considering a $6 billion to $10.5 billion program to build dedicated bus lanes, light rail, or other transit improvements.

Click image to download a four-page PDF of this policy brief.

This week’s brief will look at Department of Transportation data to gather more information about how important transit is to the Austin urban area. The most important source of data is the National Transit Database, which has tracked ridership, costs, and other transit data since 1982. Continue reading

Transit Ridership Falls Again in February

America’s transit systems carried 4.7 percent fewer riders in February 2019 than the same month in 2018, according to data released last Friday by the Federal Transit Administration. All major forms of transit saw declines except hybrid rail, which grew because of a new San Francisco Bay Area line that opened in mid-2018. Overall, rail and bus each declined by 4.7 percent.

Ridership dropped in 39 of the nation’s 50 largest urban areas. The biggest declines were in Providence (-15.9%), Milwaukee (-14.3%), Louisville (-13.0%), Detroit (-11.1%), Kansas City (-11.0%), Phoenix (-10.8%), and Philadelphia (-10.2%). Ridership even declined in Seattle (-5.8%), which had been enjoying a sustained period of growth.

The biggest ridership growth was in Richmond (12.6%), testimony in favor of that transit system’s redesign with the help of Jarrett Walker. Ridership also grew significantly in Dallas-Ft. Worth (12.2%), Denver (5.3%), Austin (5.2%), Buffalo (4.5%), Atlanta (2.8%), and Salt Lake (2.3%). Ridership also grew by less than a percent in Houston, Washington, Tampa-St. Petersburg, and San Juan. Continue reading

Excellence or Extinction?

“The fiscal year ending on June 30, 2018, continued the District’s historic journey to excellence,” says the Sacramento Regional Transit District’s 2018 financial report. Really? Based on the June 2018 National Transit Database report, Sacramento RT carried 4.5 percent fewer riders in FY 2018 than it did in FY 2017. Ridership had fallen 22 percent since FY 2014 and 42 percent since 2008. Among major transit agencies, only Greater Cleveland Regional Transit and Memphis Area Transit are doing worse.

Back in 2012, RT opened its quarterly ridership reports with a chart showing ridership each year for the previous twelve years. By 2018, RT’s ridership reports had given up on showing past ridership — too depressing, no doubt — and instead opened with charts showing on-time performance. The agency’s monthly performance reports are densely packed with information but only compare the month’s ridership with the same month of the previous year, not any years before that.

Recent ridership declines happened in spite of a 7 percent increase in service (measured by vehicle-revenue miles) since 2014. However, service declined a stunning 34 percent between 2009 and 2012, no doubt due to reduced tax revenues after the 2008 financial crisis. Recent increases in vehicle miles still leave service 27 percent below 2009. Continue reading