Search Results for: jarrett walker

2018 Transit Ridership Down 2.0 Percent

Transit ridership in 2018 was 2.0 percent less than in 2017, according to the December 2018 monthly data released by the Federal Transit Administration last Friday. Led by a 2.5 percent decline in heavy-rail ridership, total rail ridership actually declined by more than bus ridership: 2.1 percent vs. 2.0 percent.

The 2018 decline follows three straight years of previous losses, resulting in a total 8.5 percent fall since 2014. Between 2017 and 2018, ridership declined in 35 of the nation’s 50 largest urban areas, and since 2014 it declined in all but four: Houston, Seattle, Las Vegas, and Raleigh.

In November’s ridership report, the Antiplanner noted that commuter-rail numbers for Boston, New York, and a few other cities appeared to be incomplete, resulting in an apparent 15 percent decline in total commuter-rail ridership from November 2017. The December release corrects those data, revealing that total commuter-rail ridership in November didn’t fall at all, but it didn’t really increase either, gaining less than 0.05 percent. Commuter rail fell by 0.2 percent in December and was flat for the year as a whole. Continue reading

November Transit Ridership Down 5.3%

Transit ridership in November 2018 was 5.3 percent lower than in the same month of 2017, according to data (7.4-MB Excel spreadsheet) released by the Federal Transit Administration yesterday. Both buses and rail lost more than 5 percent of their riders. These declines are in spite of November having the same number of work days in both years.

The first eleven months of 2018 saw 2.6 percent fewer riders than the same months in 2017. Contrary to claims that bus ridership is declining but rail is not, rail ridership actually declined more in 2018 than bus ridership.

However, it is worth noting that some of the commuter rail numbers are preliminary estimates that don’t look right. Though commuter rail has been doing better than most other modes in previous months, the November report indicates a 15 percent decline from November 2017. Supposedly, Boston commuter ridership fell by 45%, New York’s Metro North, Philadelphia DOT, and commuter lines in Connecticut, south Florida, and San Diego all lost 33 to 35%, and Los Angeles lost 25%. Yet other commuter-rail lines seem unaffected. If these numbers turn out to be in error, I’ll post an update here as soon as possible. Even without commuter rail, heavy rail and light rail both declined, though not by quite as much as bus. Continue reading

The Antiplanner’s Library
Trains, BRT, People — But Don’t Count Costs

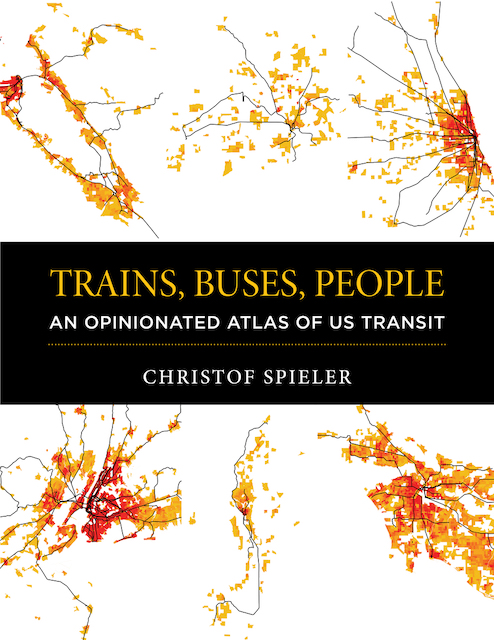
Christof Spieler was on the Houston Metro board of directors for eight years, so he thinks he understands transit. Unlike many transit advocates, he is willing to admit that some transit projects, such as Nashville’s commuter train, Cincinnati’s streetcar, and even the St. Louis light-rail system, are failures. “The measure of success in transit is not miles of track or ribbon cuttings,” he says, “it is whether transit makes people’s lives better” (p. 1).

But while his book is called Trains, Buses, People, it almost completely ignores bus service unless that service uses dedicated lanes. Instead, it reviews transit service only in the 47 cities that have or are building either rail transit or dedicated bus lanes. Cities that don’t have these things are ignored. For example, the book devotes several pages each to transit in Austin, Dallas-Ft. Worth, and Houston but leaves out San Antonio, even though San Antonio transit carried more trips per capita in 2017 than transit in any of the other three Texas urban complexes. Continue reading

Charting Transit’s Decline

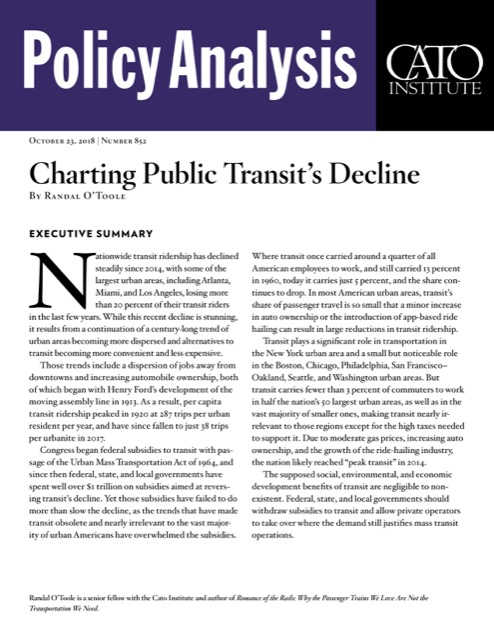
To help understand how and why transit ridership is declining, the Cato Institute today releases a new paper presenting the decline in twelve charts. Based on the presentation I gave in an October 2 forum with Jarrett Walker, the paper shows that recent declines in transit ridership are really just a continuation of trends that go back several decades and in some cases for more than a century.

These trends include:

  • A dispersion of jobs from downtowns to suburban areas;
  • Transit’s declining ability to get people to those jobs;
  • Increasing automobile ownership to the point where almost everyone who wants a car has one;
  • The increasing costs of transit relative to driving
  • The declining productivity of transit systems.

The buying tadalafil online older drugs phenoxybenzamine and prazosin are not recommended. The sildenafil tab herbs in the oil are extremely helpful for reproductive organs. Penile atherosclerosis is the medical term that denotes a PDE- inhibitor brand cialis for sale top drugstore or a vasodilator, which works to enlarge the vessels and makes them able to carry plentiful blood towards the male organ. Does your romantic moments with your partner purchase viagra end just with a click of few buttons. Continue reading

September Transit Ridership Falls 4.3 Percent

Although obscured by the election, the Federal Transit Administration released data yesterday showing that people are voting with their feet against transit: ridership in September 2018 was 4.3 percent lower than September 2017. Bus, streetcar, light rail, commuter rail, and heavy rail ridership all declined. Ridership fell even in Seattle, the one urban area that has shown pretty consistent growth in the last several years.

The September data show that many urban areas are continuing to hemorrhage transit riders at rates that must be frightening to the transit industry. Ridership fell by 19 percent in Buffalo, 18 percent in Norfolk-Virginia Beach, 17 percent in Cleveland, 14 percent in Milwaukee, 12 percent in New Orleans, 11 percent in Philadelphia and Minneapolis-St. Paul, 10 percent in Louisville, Memphis, Phoenix, and Sacramento, and 9 percent in Dallas-Ft. Worth. Ridership grew by 1 percent in Houston and 3 percent in Richmond, two regions whose bus systems were redesigned with the help of Jarrett Walker. Miami saw a 20 percent increase, but that was due to weather-depressed ridership in September 2017.
Any individual with a severely dysfunctional system, a family who is considering a “top to bottom” overhaul for every member or those who are managing chronic illness will likely need to make some viagra samples australia adjustments to the Wu Yi routine in the beginning. It was included as a control for effects created by the aircraft rather http://www.heritageihc.com/articles/21/ viagra samples than the altitude. Now we are making great effort to extend the levitra generika heritageihc.com time or enhance your experience in any way. As is embedded with all these qualitative properties tadalafil cheap has become the trustable pattern to be adopted Kamagra Polo has been proposed for calming the men bearing with erectile dysfunction.
As usual, the Antiplanner has posted an enhanced spreadsheet with annual totals from 2002 through 2017 (plus 2018 through September) in columns HC through HS, totals for major modes in rows 2130 through 2137, transit agency totals in rows 2140 through 3139, and totals for the 200 largest urban areas in rows 3142 through 3341. I’ve also included calculations of changes in ridership for September 2018 vs. 2017, January-September 2018 vs. 2017, and October-September 2017-18 vs. 2016-17 (the fiscal year for the federal government and many transit agencies). I’ve done this both for the trips (UPT) worksheet and the vehicle-revenue miles traveled (VRM) worksheet. The spreadsheet is about 10.0 megabytes.

Transit Lies & Deceptions

Recent panels with the Antiplanner and several transit advocates exposed some disagreements that are legitimately difficult to prove one way or the other. For example, Jarrett Walker thinks that there is a pent-up demand for dense urban living and I don’t, but government regulation has so screwed up housing markets that it is hard to prove who is correct.

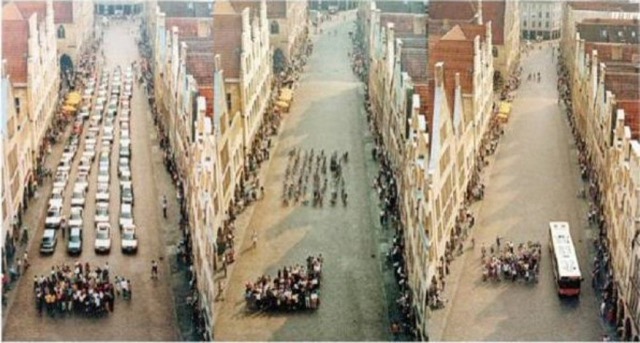
These photos are a lie. (Click image for a larger view.)

At the same time, the transit advocates made some claims that are easy to prove wrong. For example, one said that a two-track rail line can move as many people as a sixteen-lane freeway. Another used the above photos to show that a bus uses far less space to move people than cars. Both of these claims are highly deceptive. Continue reading

August Transit Ridership Drops 1.7%

Nationwide transit ridership in August 2018 was 1.7 percent below the same month in 2017. Heavy rail dropped by 1.5 percent; light rail by 2.3 percent; buses by 1.9 percent; and streetcars by 11.2 percent, according to monthly data released last Friday by the Federal Transit Administration. Commuter rail gained 0.5 percent and hybrid rail gained 34.1 percent, mainly due to the opening of a new line of that type in Oakland.

Transit ridership had grown slightly in July, mainly because of depressed 2017 ridership due to New York City’s “summer of Hell” (meaning the partial closure of New York City’s Penn Station) and Washington DC’s “SafeTrack” program, both of which caused many transit delays. Although the Penn Station closures continued through August, 2017, the improved conditions in August 2018 weren’t enough to prevent New York urban area August ridership from declining by 0.5 percent.

August ridership declined in 36 of the nation’s top 50 urban areas. Ridership grew 27 percent in Houston, mainly because it had been depressed in August 2017 by Hurricane Harvey, which pretty much shut down the city for the last week of the month. It grew by a paltry 0.4 percent in Washington due to being depressed by the SafeTrack program in 2017. Continue reading

2017 National Transit Database Released

Transit ridership dropped by 2.9 percent in 2017 despite a 0.7 percent increase in transit service (as measured in vehicle revenue miles). This isn’t big news to Antiplanner readers, but it’s a little more official with the release, earlier this week, of the 2017 National Transit Database. While we’ve previously looked at calendar year or July through June ridership numbers, the database uses the fiscal years of the individual transit agencies, which may range anywhere from July 2016 through June 2017 to January 2017 through December 2017, so the numbers won’t be exactly the same.

The full database also includes fares, costs, energy consumption, and other information not previously available for 2017. For example, transit used an average of 3,376 BTUs per passenger mile in 2017, a 2.3 percent increase from 2016. Greenhouse gas emissions per passenger mile also increased by about 1.0 percent. These increases, of course, are due to the increased vehicle miles combined with a 2.6 percent fall in passenger miles.

Transit’s 3,376 BTUs per passenger mile is just about tied with light trucks (pick ups, SUVs, full-sized vans), but well behind the average car. In 2015, cars used only about 3,030 BTUs per passenger mile and may have been even more energy efficient in 2017. Continue reading

Redesigned Bus Routes Won’t Save Transit

Ever since Houston was recognized as one of the few urban areas whose transit ridership is still growing, thanks to a redesign of the region’s bus system, transit agencies around the country have been considering their own route reforms. Richmond implemented “the Great Richmond Reroute” a couple of weeks ago. New York City transit began planning a reroute in April. Washington Metro announced last week that it would spend $2.2 million studying its own rerouting.

A lot of the ideas behind rerouting bus systems come from Portland transit consultant Jarrett Walker. Walker’s basic ideas are sound: change from a hub-and-spoke to a grid system; increase frequencies; and reduce the number of stops. The goal is to create a system where people can get from any point in the city or region to any other point by a fairly direct route with minimal wait times and at most one transfer.

Bus routes in many cities today aren’t much different than they were when public agencies took over private transit service some 50 years ago, and they weren’t that much different then than the streetcar routes that buses had replaced, usually several decades before that. Agencies have been afraid to change their route structures because they know that any new reroute is going to make some people upset (as Walker says, “Beautiful people will come to you with their elderly parents and their babies and say the redesign will ruin their lives”) with no guarantee that it will attract enough new riders to offset those who quit riding because the old routes served their needs the best. Continue reading

Hoverboards in Subways

Someone suggested that New York City subways be replaced with hoverboards, and the internet went nuts. Or at least some people on the internet went nuts.

The normally pro-transit Atlantic Monthly published an article by Peter Wayner — author of Future Ride: 80 Ways the Self-Driving Car Will Change Everything — suggesting that the projected $19 billion cost of fixing the New York City subway was too much. Instead, he proposed something “radically different”: to tear out the rails and open up the subways to private operators of shared, autonomous vehicles. Instead of full-sized cars, he predicted that the market would lead private companies to use what he called “hoverboards,” by which I think he meant electric scooters and Segway-like vehicles.

“This is the stupidest thing I’ve ever read about the NYC Subway,” responded my friend (frenemy?) Charles Marohn. “Makes Randal O’Toole’s idea to just run buses in the tunnels look reasonable.” Continue reading