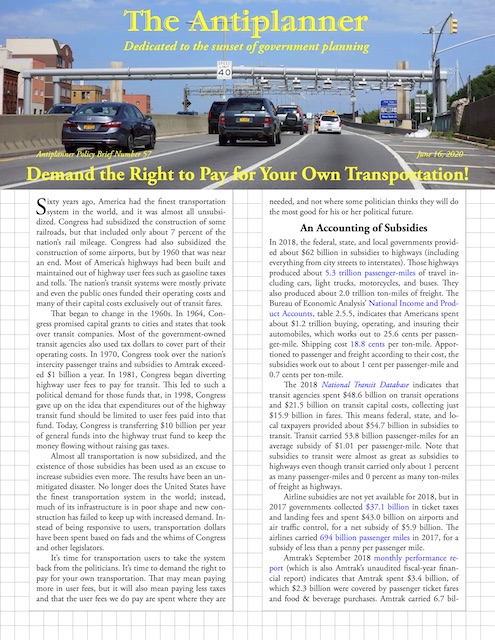
Search Results for: kansas city streetcar

Light-Rail Disasters

Now that the COVID-19 pandemic has reduced ridership in many transit systems by as much as 90 percent, it almost seems nostalgic to look back to a time when transit ridership was only dropping because of low gas prices, ride hailing, and inept transit agency management. Among those ineptitudes documented in recent Antiplanner policy briefs were Los Angeles Metro’s insistence on building light rail despite its proven track record of losing five bus riders for every rail rider gained and Portland’s insistence on sticking with light rail despite the fact that doing so reduced the capacity of the transit system to move people through downtown Portland.

Click image to download a four-page PDF of this policy brief.

This raises the question of whether light rail has worked anywhere in the country. Transit agencies in seventeen urban areas that had no rail transit in 1980 have built light rail lines since then. This paper will look at each of these systems to see whether they have contributed to or detracted from their regions’ transit systems. I’ll also include Cleveland and Pittsburgh, both of which upgraded older streetcar lines to light-rail standards after 1980. Continue reading

The Futility of Trying to Reduce Driving

Nearly fifty years ago, a friend of mine named Ron Buel (who at the time was the chief of staff to Portland city commissioner Neil Goldschmidt) wrote a book titled Dead End: The Automobile in Mass Transportation. Buel argued that cars harmed cities and the people living in them, and at the time he and other critics of the automobile seemed to make a lot of sense.

Click image to download a four-page PDF of this brief.

After all, in 1965, Ralph Nader’s Unsafe at Any Speed had shown that cars were death traps, killing almost as many Americans each year as ten years of the Viet Nam war. A look out a Portland window on a sunny day showed that cars were pollutomobiles, putting a grey layer of unhealthy smog over the city that was so thick people couldn’t see Mt. Hood, 50 miles away. In 1973, the OPEC oil embargo would make Americans painfully aware that their automobiles were also gas hogs. Continue reading

44. Fighting Obsolete Transit

In 1991, Congress passed the Intermodal Surface Transportation Efficiency Act. It should have been called the Obsolete Transportation Inefficiency Act, as among other things it created a multi-billion-dollar annual slush fund to give to cities to build new rail transit projects. This fund, informally called New Starts and more formally called Transit Capital Investment Grants, had no limit on the amount of money any city could take out of it, which gave cities incentives to propose the most expensive projects they could so they could get the most “free” federal money.

This law was actually a continuation of a 1973 law that allowed cities to cancel planned interstate freeways within their borders and spend the federal dollars that would have gone towards building those freeways on transit capital improvements instead. The 1973 law was instigated by then-Massachusetts Governor Francis Sargent, who wanted to cancel some freeways in Boston but didn’t want to be accused of “losing” federal transportation dollars. Boston, of course, has lots of rail transit and could easily absorb the federal dollars from a cancelled freeway by buying new railcars, installing new signals, replacing track, and so forth.

Sargent’s law gave hope to Portland Mayor (and infamous pedo) Neil Goldschmidt, who wanted to cancel an interstate freeway in east Portland. But Portland’s transit agency, TriMet, only operated buses, and if it used all of the freeway funds to buy new buses, it wouldn’t have enough money to operate all of those buses. Continue reading

Time to End State & Local Road Subsidies

State and local subsidies to highway users averaged 1.9ยข per vehicle mile in 2018, according to data recently released by the Federal Highway Administration. The average vehicle on the road has about 1.67 occupants, so subsidies per passenger mile average 1.2 cents.

Click image to download a four-page PDF of this policy brief.

By far the majority of these subsidies were at the local level. While exact calculations are not possible, I estimate state subsidies averaged 0.3 cents per vehicle mile while local subsidies averaged 4.4 cents per vehicle mile. Continue reading

Urban Transit Is an Energy Hog

Transit is often touted as a way to save energy. But since 2009 transit has used more energy, per passenger mile, than the average car. Since 2016, transit has used more than the average of cars and light trucks together.

Click image to download a four-page PDF of this policy brief.

Automobiles and planes are becoming more energy efficient each year. But the annual reports of the National Transit Database reveals that urban transit is moving in the opposite direction, requiring more energy to move a person one mile in each of the last four years. Continue reading

Reducing Mobility to Boost Transit

Reeling from five years of ridership declines, the transit industry is stumbling around looking for a new mission, or at least new strategies to restore some of its revenues. New research and on-the-ground experience suggests the task will be difficult and may be hopeless.

Click image to download a four-page PDF of this policy brief.

The opening pages of the American Public Transportation Association’s (APTA) recently released 2019 Transit Fact Book present a cheery picture of transit’s success by comparing 2018 transit numbers with numbers from the 1990s, which saw historic lows in transit ridership. Yes, ridership grew from 1995 to 2014, but bus ridership peaked in 2008 and rail in 2014 and both have been declining since then, a reality APTA hopes people will overlook. This is typical of the kind of cherry-picking of data that transit advocates so often use to promote their agendas. Continue reading

Ridership Falls Another 2.9 Percent in June

June 2019 transit ridership was 2.9 percent lower than in June 2018, according to the Federal Transit Administration’s most recent data release. Ridership dropped in all major modes, including bus, commuter rail, heavy rail, and light rail. Ridership also dropped in 41 of the nation’s 50 largest urban areas, declining even in Seattle, which had previously appeared immune to the decline that is afflicting most of the nation’s transit industry.

Click image to download a three-page PDF of this policy brief.

June had 20 workdays in 2019 compared with 21 in 2018. The National Household Transportation Survey estimates that about 40 percent of transit ridership is work-related, so one fewer day accounts for about 1.9 percent of the decline in ridership. So at least a third of the decline must be due to other factors. Continue reading

10. Los Angeles Metro’s New Climate Strategy

Los Angeles is “hemorrhaging bus riders,” worries the Los Angeles Times. This is supposedly “worsening traffic and hurting climate goals.”

Click image to download a PDF of this policy brief.

L.A. Metro buses “have lost nearly 95 million trips over a decade,” the paper notes. This “25% drop is the steepest among the busiest transit systems in the United States.” Actually, Sacramento’s Regional Transit District has lost 43 percent of its bus riders in the last decade, but the Times probably doesn’t count it “among the busiest transit systems.” Continue reading

Is This Infrastructure Really Necessary?

The United States has “at least $232 billion in critical public transportation” needs, claims the American Public Transportation Association (APTA). Among the “critically needed” infrastructure on APTA’s list are a streetcar in downtown Los Angeles, another one in downtown Sacramento (which local voters have rejected), one in Tempe, and streetcar extensions in Tampa and Kansas City.

Get real: even ardent transit advocates admit that streetcars are stupid. The economic development benefits that supposedly come from streetcars are purely imaginary, and even if they weren’t, it would be hard to describe streetcars — whose average speed, APTA admits, is less than 7.5 miles per hour — as “critically needed.”

Much of the nation’s transit infrastructure is falling apart, and the Department of Transportation has identified $100 billion of infrastructure backlog needs. (Page l — that is, Roman numeral 50 — of the report indicates a backlog of $89.9 billion in 2012 dollars. Converting to 2019 dollars brings this up to $100 billion.) Yet APTA’s “critical needs” list includes only $24 billion worth of “state of good repair” projects. Just about all of the other “needs” listed — $142 billion worth — are new projects or extensions of existing projects. Continue reading

January Transit Ridership Drops 4.4%

Nationwide transit ridership in January 2019 was 4.4 percent lower than the same month in 2018, according to data released yesterday by the Federal Transit Administration. Ridership fell for every major mode, including commuter rail (-0.6%), heavy rail (-4.9%), light rail (-0.5%), streetcars (-2.6%), and buses (-4.5%). January had the same number of work days in 2018 and 2019, so that wasn’t a factor in the decline for the month.

Year-over-year ridership (February through January) fell by 2.2 percent, and also fell for every major mode: -0.1% commuter rail, -2.7% heavy rail; -1.0% light rail; -1.3% streetcars, and -2.1% buses. Ridership did grow by 44 percent in January and 20 percent for the year for the minor mode that the FTA calls “hybrid rail,” meaning Diesel-powered light rail. It grew mainly because of the opening of a new line in Oakland.

January ridership fell in 33 of the nation’s 50 largest urban areas, and year-over-year ridership fell in 38 of them. Only seven of the top fifty urban areas enjoyed ridership growth both in January and in the February-January year: Houston, Indianapolis, Austin, Providence, Nashville, Richmond, and Raleigh. Continue reading