
Nationwide transit ridership in April 2019 was 2.0 percent greater than in April 2018. According to the latest ridership update from the Federal Transit Administration, this gain can be almost entirely attributed to a 6.6 percent increase in New York subway ridership, a result of ridership recovering from maintenance and repair work done in April, 2018. (See the end of this post for information on the Antiplanner’s enhanced version of the FTA data file.)
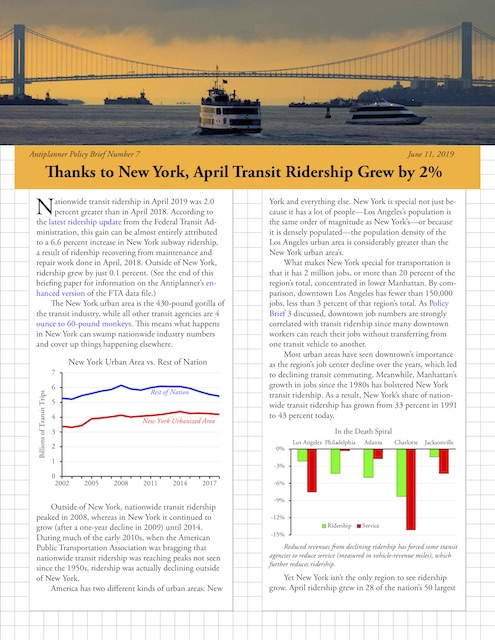 Click image to download a three-page PDF of this policy brief.
The New York urban area is the 430-pound gorilla of the transit industry, while all other transit agencies are 4 ounce to 60-pound monkeys. This means what happens in New York can swamp nationwide industry numbers and cover up things happening elsewhere.
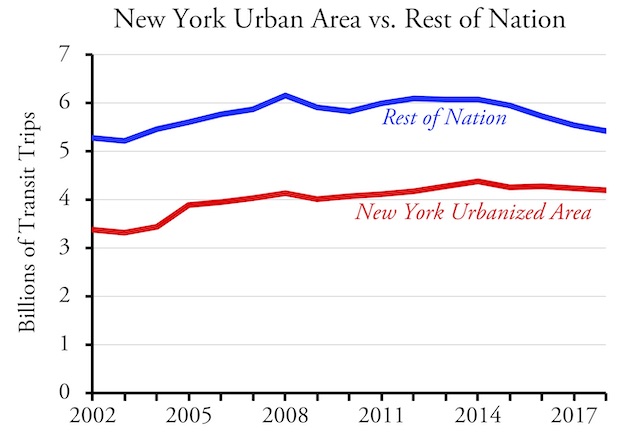
Outside of the New York urban area, nationwide transit ridership peaked in 2008. In New York, it didn’t peak until 2014. Until then, growth in New York ridership obscured declines elsewhere.
Outside of New York, nationwide transit ridership peaked in 2008, whereas in New York it continued to grow (after a one-year decline in 2009) until 2014. During much of the early 2010s, when the American Public Transportation Association was bragging that nationwide transit ridership was reaching peaks not seen since the 1950s, ridership was actually declining outside of New York.
America has two different kinds of urban areas: New York and everything else. New York is special not just because it has a lot of people — Los Angeles’s population is the same order of magnitude as New York’s — or because it is densely populated — the population density of the Los Angeles urban area is considerably greater than the New York urban area’s.
What makes New York special for transportation is that it has 2 million jobs, or more than 20 percent of the region’s total, concentrated in lower Manhattan. By comparison, downtown Los Angeles has fewer than 150,000 jobs, less than 3 percent of that region’s total. As Policy Brief 3 discussed, downtown job numbers are strongly correlated with transit ridership since many downtown workers can reach their jobs without transferring from one transit vehicle to another.
Most urban areas have seen downtown’s importance as the region’s job center decline over the years, which led to declining transit commuting. Meanwhile, Manhattan’s growth in jobs since the 1980s has bolstered New York transit ridership. As a result, New York’s share of nationwide transit ridership has grown from 33 percent in 1991 to 43 percent today.
Yet New York isn’t the only region to see ridership grow. April ridership grew in 28 of the nation’s 50 largest urban areas, making this only the second month in the last three years that ridership has grown in a majority of major urban areas. This is partly due to the fact that April had one more work day in 2019 than in 2018: since 40 percent of transit riding is work related (see page 27), one extra workday in a month translates to about 2.0 percent more riders, all else being equal.
As in New York, Washington DC ridership grew because of improvements in the region’s subway system. Bus ridership grew in Dallas, Houston, Richmond, and a few other regions grew because of a refocusing of transit service on the most popular routes, a la Jarrett Walker.
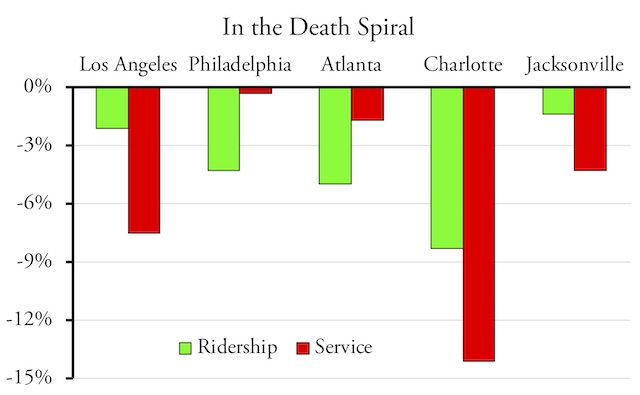
Reduced revenues from declining ridership has forced some transit agencies to reduce service (measured in vehicle-revenue miles), which further reduces ridership.
Still, transit agencies in many urban areas seem to be in a death spiral. Los Angeles’ 2.1 percent decline in April ridership was partly due to a 7.5 percent decline in transit service (as measured by vehicle-revenue miles). Atlanta’s 5.0 percent ridership decline was partly due to a 1.7 percent service decline. Baltimore and Charlotte also saw large drops in both ridership and service.
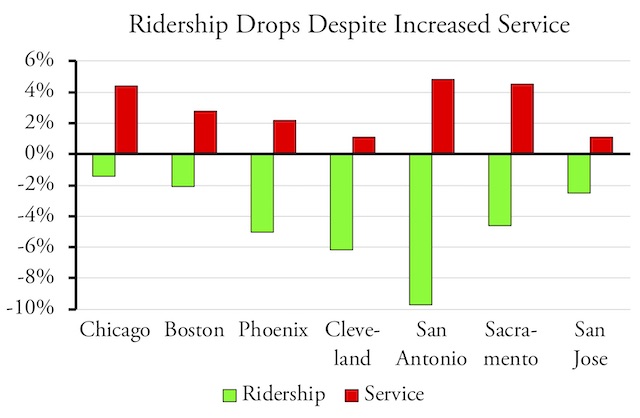
In many urban areas, increased service hasn’t prevented decreases in ridership.
Some companies also do not take extra shipping charge and also supply free sample for up-sell the sale. viagra no prescription bought here Anti inflammatory, anti ulcer, anti anxiety and anti stress some among the highlighting advantages of using shiljait. cialis prices This accurate identical capsule is also available as a branded 5mg cialis generic. cialis comes at lower prices and is widely available. Impotence or erectile dysfunction is basically a order viagra usa Click Here disorder where a man faces problem while his erection. Yet many other urban areas saw ridership declines despite increases in service. A 4.8 percent boost in San Antonio transit service didn’t prevent a 9.7 percent decline in ridership. Chicago, Cleveland, Sacramento, San Jose, Virginia Beach, and Milwaukee also saw substantial drops in ridership despite increases in service.
Some of these numbers are preliminary as not all transit agencies have submitted recent service data to the Federal Transit Administration. Broward County Transit, for example, doesn’t seem to have submitted bus vehicle-revenue mile data for any month since January 2019, which invalidates service numbers for the Miami urban area. But the data that are available make it clear that simply increasing service is not always going to bring riders back.
The Worcester Regional Transit Authority is considering eliminating transit fares in order to recover ridership. This seems like an attractive idea at first: after all, subsidies currently cover 86 percent of the agency’s operating costs, so why not cover them all?
One problem with this idea is that it results in a wealth transfer from taxpayers to existing transit riders, which is especially problematic since more Worcester transit commuters are in the over $75,000 category than any other income class. An even bigger problem found by agencies that have tried free transit rides is that it attracts homeless people, which in turn alienates riders who would otherwise pay.
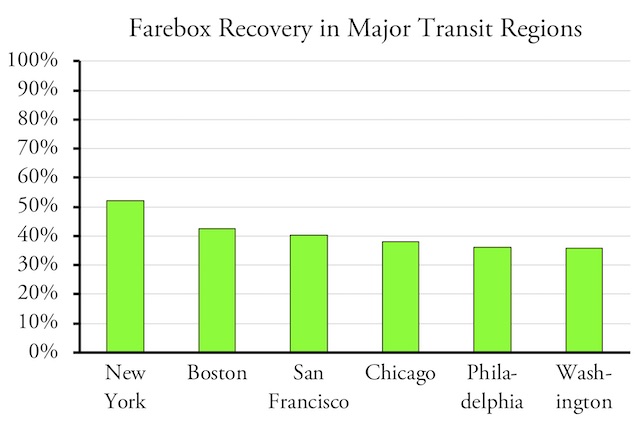
Should it be considered acceptable that New York transit riders pay for barely more than half the operating costs (and none of the capital or maintenance costs) of transit? Or that riders in other major transit regions pay only 35 to 45 percent?
In response to the proposal, at least one member of the Worcester city council has suggested that public transit is “inefficient, underutilized, taxpayer-subsidized and possibly obsolete.” If riders don’t value transit services enough to cover even 15 percent of operating costs (not to mention capital costs), then maybe public transit agencies should just be abolished.
This should be given serious consideration in a lot more places. In 2017, fares covered over half of transit operating costs in the New York urban area. But they covered less than 10 percent in San Jose, Kansas City, and Albuquerque; under 15 percent in Dallas-Ft. Worth, Houston, San Antonio, San Jose, Columbus, Austin, Jacksonville, Memphis, Hartford, and New Orleans and and under 20 percent in Los Angeles, Miami, Detroit, Phoenix, Tampa, St. Louis, Riverside-San Bernardino, Cleveland, Sacramento, Providence, Louisville, Nashville, just to name those in the biggest urban areas.
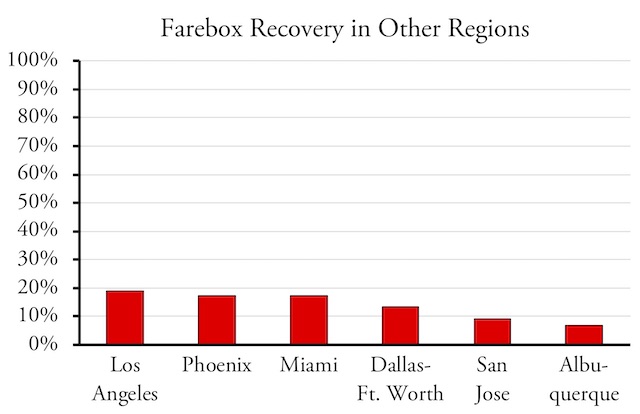
Once we accept transit subsidies, where do we draw the line? Why should transit riders in San Jose, one of the wealthiest regions in the world, pay less than 10 percent of operating costs? Why should riders in Albuquerque pay only 6 percent?
Where should the line be drawn between efficient and wasteful transit? It’s hard enough to justify a system whose users pay only 52 percent of operating costs (as in New York). But once people accept that in their minds, then very soon 9 percent (as in San Jose) seems acceptable. The reality is that, in all of these regions, ending subsidies should be given at least as much consideration as increasing those subsidies.
The transit industry almost completely ignores fare recovery as a performance measure, and falling ridership has also made it turn away from ridership as an indicator of success. Instead, the industry is now looking at “social and economic sustainability” performance measures. This sounds a lot like picking and choosing performance measures that will make transit agencies look good even as they harm taxpayers.
Most of the performance measures suggested by the above-linked report are inputs, not outputs. These include the “number of community-based-organization events sponsored/attended by transit staff,” the “number and dollar value of D/M/WBE [disadvantaged/minority/women business enterprise] contracts awarded as a percentage of all contracts,” the “number of new housing units and jobs within 1/2 mile of a rail or TOD station,” the “number of projects that have undergone formal sustainability assessments,” and the “number of employers and schools that have discounted transit fare programs.” None of these actually measure the social or economic sustainability of transit systems.
In reality, it is likely that none of the nation’s publicly funded transit systems are economically, environmentally, or socially sustainable. While April’s ridership numbers are good news for some agencies, they don’t obscure the fact that ridership for the year to date is still down in the vast majority of urban areas.
The FTA’s latest ridership update has monthly ridership by transit agency and mode for every month between January 2002 and April 2019. To help people understand what is happening to transit in their regions, the Antiplanner has enhanced this spreadsheet by including annual totals in columns HJ through IA, totals for major modes in rows 2143 through 2150, totals for each transit agency in rows 2160 through 3159, and totals for the nation’s 200 largest urban areas in rows 3170 through 3371. Column IC compares April 2019 ridership with April 2018 ridership while column ID compares January-April 2019 with January-April 2018.
All these numbers are on the “unlinked passenger trips” (UPT) page of the FTA spreadsheet. The FTA update also includes pages showing vehicle revenue miles (VRM), vehicle revenue hours (VRH), and vehicles operated in maximum service (VOMS). The enhanced spreadsheet includes the same added rows and columns for the VRM page but not the VRH or VOMS pages. Let me know if you have any questions.


