March Driving 99.9% of 2019

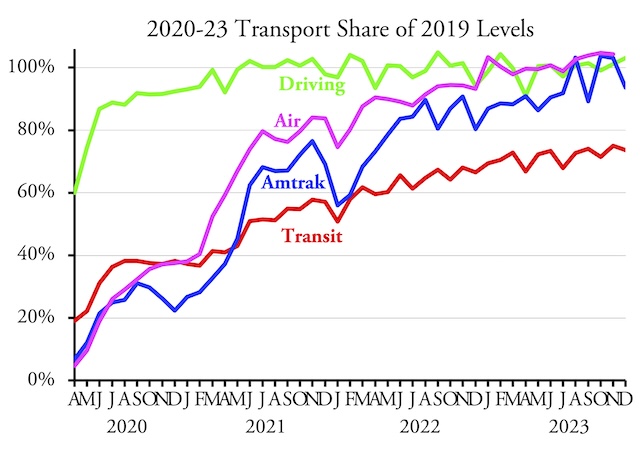
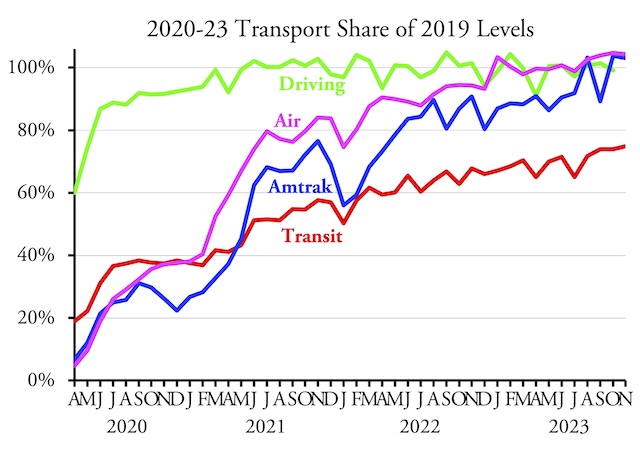
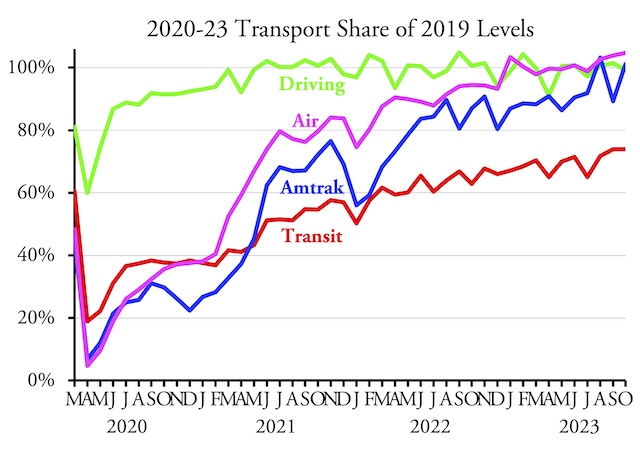
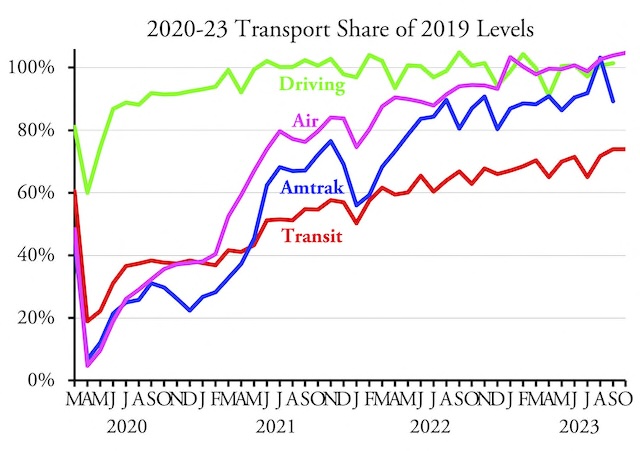
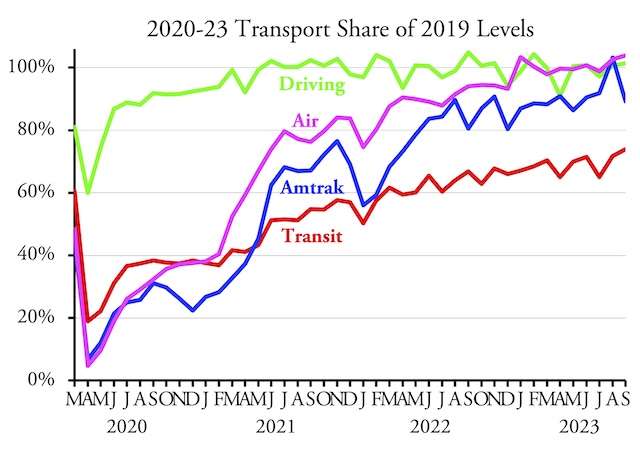
Americans drove 99.9 percent as many miles in March 2023 as in the same month in 2019, according to data released by the Federal Highway Administration on Friday. Rural driving was 4.1 percent greater than in 2019, and driving on urban interstates was 1.5 percent greater, but other urban driving was 3.1 percent less than in 2019, dragging down the overall average.

See May 5 post for discussion of transit, Amtrak, and airline travel.

I have to say I’m a little bit skeptical of these numbers. Throughout the pandemic, rural driving has been a bit ahead of urban, so that makes sense. However, urban interstate driving was generally behind other urban driving. Why is it suddenly ahead now? Continue reading

Transit Carries 70% of 2019 Riders in March

America’s transit systems carried 70.3 percent as many riders in March 2023 as in the same month in 2019, according to data released yesterday by the Federal Transit Administration. I reported last month that transit also carried 70 percent in February as in 2019, but that was due to a minor error that crept into my spreadsheet. The actual number was 68.5 percent, so transit is still gaining slowly compared with the pre-pandemic era. However, March 2023 had two more business days than March 2019, while the two Februaries had the same number, which is probably responsible for some of March’s improvement.

The Transportation Security Administration reports that 97.8 percent as many passengers passed through airport security in March 2023 as in March 2019. That’s down from the 100.3 percent in February. The actual number of passengers increased from 58 million to 72 million, but that’s just seasonal variations. Continue reading

2021 Transportation Subsidies

Government subsidies to all modes of transportation except highways greatly increased during the pandemic even as most passenger transportation declined. According to data recently released by the Department of Transportation, subsidies to driving rose 39 percent in 2021 than 2019, while subsidies to all other passenger modes increased by 180 to 350 percent.

Per passenger-mile subsidies to Amtrak were 30 times greater than subsidies to air travel in 2021, while per passenger-mile subsidies to transit were more than 230 times greater than subsidies to driving.

According to just-released table HF-10 from the 2021 Highway Statistics, government agencies spent $97.5 billion in property taxes and other general funds on highways in 2021, up from $80.3 billion in 2019. However, part of this expense was offset by diversion from highway user fees to transit and other non-highway activities. These diversions amounted to $38.1 billion in 2021, up from $33.3 billion in 2019. The net subsidy to highways, then, was $59.5 billion in 2021, up from $45.1 billion in 2019. Continue reading

Homelessness Down Since 2010, Up Since 2020

Nearly 600,000 Americans were homeless in 2022, according to a report recently released by the Department of Housing and Urban Development (HUD). The department has been attempting to count homeless numbers each year since 2007, and the latest numbers are based on counts made in January 2022.

Click image to download a 15.5-MB PDF of this 112-page report.

According to HUD’s counts, the total number of homeless people in the U.S. grew by nearly 2,000 between 2020 and 2022 — but that’s just 0.3 percent and easily within the margins of error of the counts. HUD also estimates the number declined by more than 54,600 between 2010 and 2022, which is large enough to be more likely. Continue reading

U.S. Drove 4.3% More Miles in 2/23 Than in 2/19

Americans drove 224.1 billion miles in February 2023, which was 4.3 percent more than in the same month in 2019, according to data released by the Federal Highway Administration yesterday. This was the biggest increase in driving over pre-pandemic levels since the pandemic began.

For more information on transit, Amtrak, and air travel, see Monday’s post.

Driving increased, relative to 2019, on all kinds of roads in both urban and rural areas. Urban driving was 2.5 percent greater than in 2019; rural driving was 10.2 percent greater. Continue reading

Transit Carries 70% of 2019 Riders in February

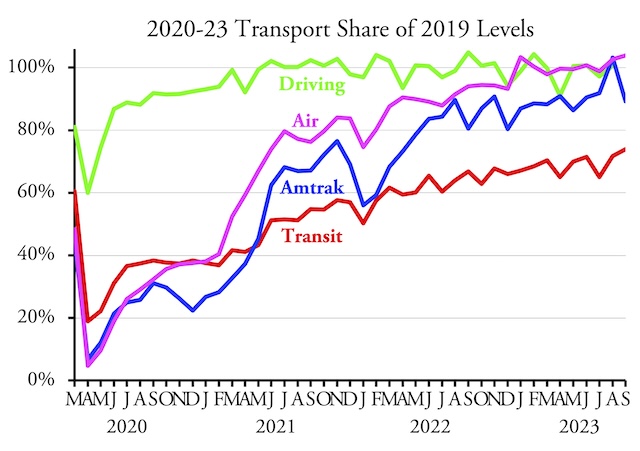
Public transit carried 70.2 percent as many riders in February 2023 as it did in the same month in 2019, according to data released by the Federal Transit Administration late last week. This is the first time ridership has exceeded 70 percent of 2019 numbers since February 2020.

The transit line on this chart has been updated to reflect the latest adjustments to the National Transit Database going back to late 2020.

Amtrak, meanwhile, reports that it carried close to 89 percent as many passenger-miles and the Transportation Security Administration reports that airlines carried more than 100 percent as many passengers in February 2023 as in February 2019. February highway data will be released later this month. Continue reading

U.S. Per Capita Travel Was 18,000 Miles in 2021

Per capita travel in the United States was a little lower in 2021 than 2019, according to data recently released by the Bureau of Transportation Statistics (BTS). In 2021, the average American traveled 17,909 miles by air, auto, transit, and Amtrak, down 8 percent from 19,475 miles in 2019.

Photo by Ken Kistler.

To calculate that number, however, I had to correct an error in the recently released spreadsheet, which says that domestic airlines carried 172.8 billion passenger-miles in 2021, just 23 percent of the 754.5 billion miles they carried in 2019. This is an obvious typo, as another BTS table says that domestic airline flights carried 571.8 billion passenger-miles. (To view passenger-miles on that web site, click on “Revenue Passenger-Miles” at the top of the table.) Continue reading

Population Falls in 18 States

Between 2021 and 2022, the populations of California, Illinois, and New York all declined by more than 100,000 people, according to estimates released yesterday by the Census Bureau. Louisiana, Oregon, Pennsylvania, and West Virginia all lost more than 10,000 residents, while 11 other states also declined in population.

Red, orange, and yellow states lost population, while green states gained. No state lost between 50,000 and 99,999, so there is no color for that group. Click image for a larger view.

The nation as a whole grew by 1.26 million, but clearly that gain was not evenly distributed. Instead, Texas grew by 470,000 residents, Florida by 416,000, North Carolina by 133,000, Georgia by 125,000, Arizona by 94,000, South Carolina by 89,000, and Tennessee by 83,000 (all these numbers are rounded to the nearest 1,000). Percentagewise, the fastest growing states were Florida (1.9%), Idaho (1.8%), South Carolina (1.7%), Texas (1.6%), South Dakota, and Montana (1.5% each). Arizona, Delaware, Georgia, North Carolina, Tennessee, and Utah all grew by more than 1 percent. The biggest losers were New York (-0.9%) Illinois (-0.8%), Louisiana (-0.8%), West Virginia (-0.6%), Hawaii (-0.5%), and Oregon (-0.4%). Continue reading

Amtrak Carries 87% of Pre-Pandemic Pass-Miles

Amtrak carried 87.0 percent as many passenger-miles in January 2023 as in January 2019, according to the state-owned company’s monthly performance report released earlier this week. That’s up from December’s 80 percent but down from November’s 91 percent.

Amtrak ridership seems to be bouncing around between 80 and 90 percent of pre-pandemic levels.

Amtrak’s January ticket revenues were only 83 percent of January 2019, but its basic operating expenses were 122 percent of 2019’s. As a result, its net losses were 52 percent greater in January 2023 than the same month in 2019. Continue reading

Transit Ridership Falls in January

Transit carried 66.4 percent as many riders in January 2023 as January 2019, according to data released by the Federal Transit Administration earlier this week. Though this is a slight improvement from the 66.0 percent of December 2022, the total number of January riders was lower than December’s. This is unusual: normally, January sees more riders than December. January 2023 had one fewer working day than January 2019, which may have contributed to the decline in ridership from December.

Transit ridership has hovered around 66 percent of pre-pandemic (2019) numbers for the last five months, suggesting it may not grow much further. Early in the pandemic, I predicted that ridership would never recover to more than 75 percent of pre-pandemic levels, which I later revised downwards to 70 percent (a projection supported by McKinsey). That’s looking to be slightly too high. Continue reading