July 2023 Transit Ridership 65% of July 2019

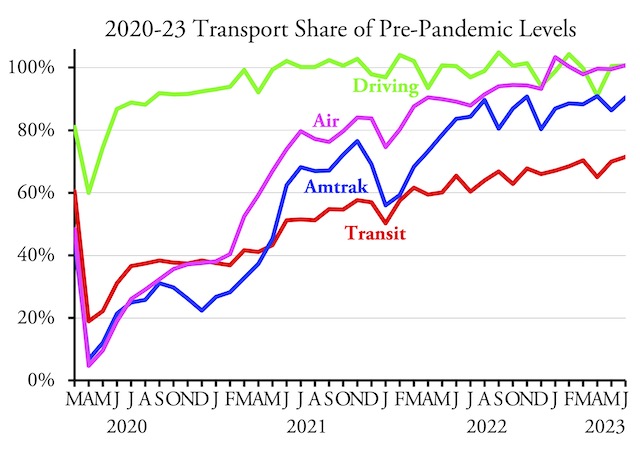
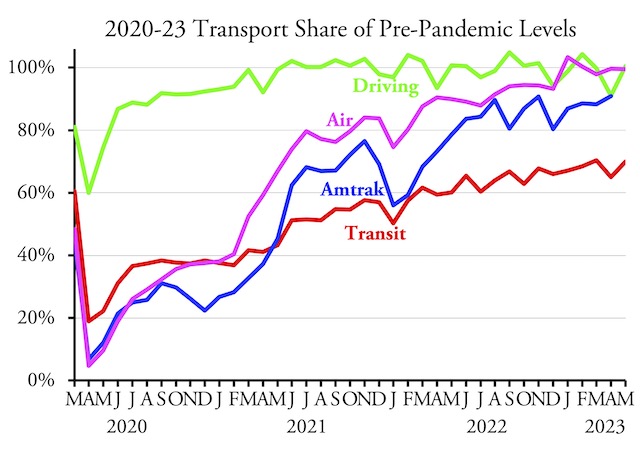
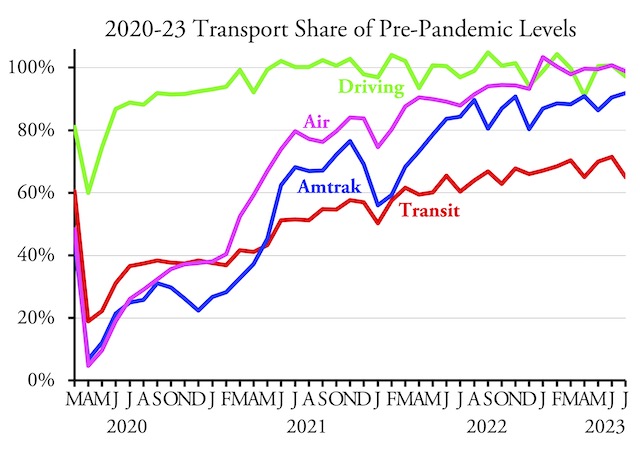
After reaching 70 percent of pre-pandemic numbers in June, transit ridership in July fell back to 65 percent of July 2019, according to data released last week by the Federal Transit Administration. Since July 2019 had 22 working days while July 2023 only had 20, this decline is not surprising.

Meanwhile, Americans drove 97.2 percent as many miles in July 2023 as in the same month of 2019, according to Federal Highway Administration data released last week as well. Amtrak’s monthly performance report indicates that the railroad carried 91.2 percent as many passenger-miles in July 2023 as July 2019, while the Transportation Security Administration says that 98.8 percent as many travelers passed through security in July as in 2019. Continue reading

June Driving 0.75% Greater Than in 2019

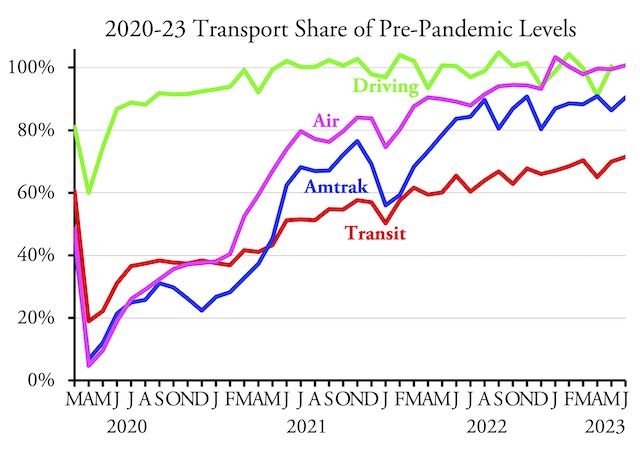
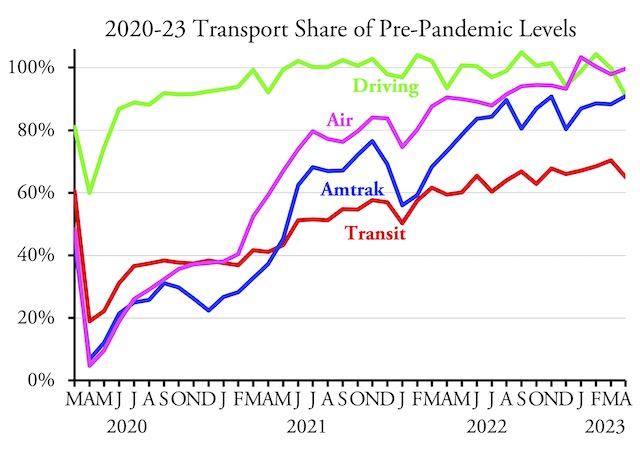
Americans drove slightly more miles in June 2023 than they did in June 2019, according to data released yesterday by the Federal Highway Administration. Highway driving first reached 100 percent of pre-pandemic levels in June of 2021 and has been hovering around 100 percent ever since. In comparison, flying didn’t reach 100 percent until January of this year, while Amtrak has been hovering around 90 percent since August 2022 and transit has never exceeded 72 percent.

For a detailed discussion of Amtrak results, see last Tuesday’s post. For a detailed discussion of transit and airline results, see last Saturday’s post.

Urban driving was only 99.0 percent of pre-pandemic levels, but rural driving more than made up for it at 105.3 percent. Total miles of driving exceeded 2019 numbers in 27 states, with the biggest gains in Idaho (117%), Missouri (114%), Alaska (114%), Colorado (113%), Wyoming (112%), and Michigan (111%). Driving is still only 76 percent of pre-COVID levels in the District of Columbia and is also woefully short in Illinois (84%), Massachusetts (91%), Maryland (92%), California (93%), Hawaii (94%), Washington (94%), and Georgia (94%). Driving in all other states was at least 95 percent of 2019 miles. Continue reading

Amtrak Carried 90.5% of 2019 PM in June

Amtrak carried 90.5 percent as many passenger-miles in June 2023 as the same month in 2019, according to the company’s monthly performance report released yesterday. This is only the third time Amtrak exceeded 90 percent of pre-COVID levels; the first time, in November 2022, it carried 90.8 percent and the second time, in April 2023, it carried 90.9 percent.

Data for driving is not yet available but an update will be posted here when it is. See Saturday’s post for a discussion of transit and air travel.

When measured by number of riders, the Northeast Corridor performed best, carrying 93.6 percent of 2019 numbers. Long-distance trains carried 85.5 percent while state-supported day trains carried just 81.4 percent. Amtrak didn’t reveal passenger-miles by train in 2019 so a comparison using that measure by route or train type isn’t possible. Continue reading

June Transit Carried 71% of Pre-COVID Riders

America’s transit agencies carried 71.4 percent as many riders in June 2023 as they did in the same month of 2019, according to data released by the Federal Transit Administration yesterday. This is the highest percentage of 2019 ridership since February, 2020. One reason for the gain above previous months is that June had two more business days in 2023 than it did in 2019.

Data are not yet available for highway or Amtrak travel. However, boarding numbers from the Transportation Security Administration indicate that the airlines carried 100.8 percent as many riders in June of 2023 as June of 2019. I’ll post updates for driving and Amtrak when those data are released. Continue reading

Amtrak Carried 86% of Pre-Pandemic PM in May

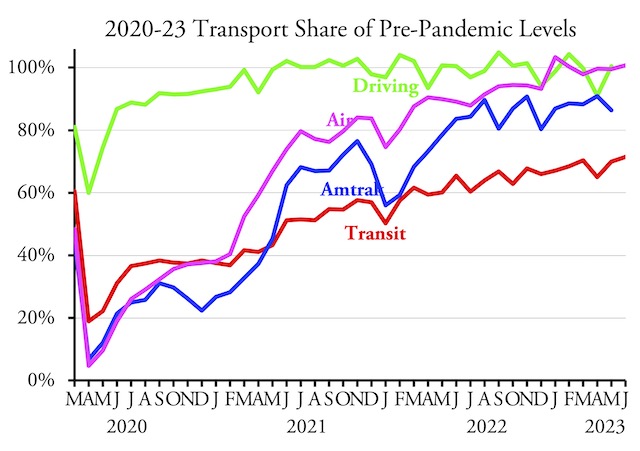
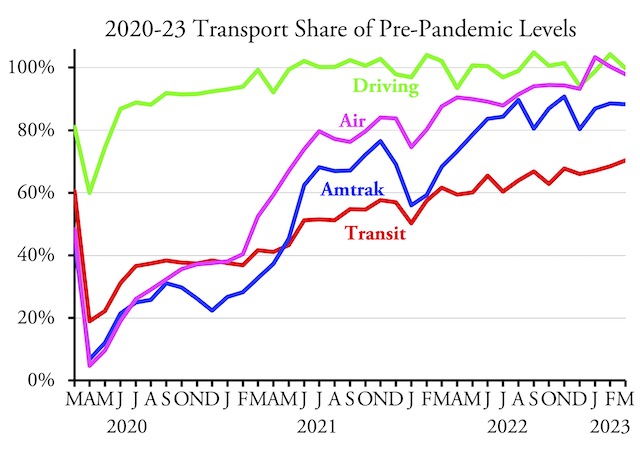
Amtrak carried 492 million passenger-miles in May 2023, which was just 86.4 percent of the 569 million passenger-miles it carried in the same month of 2019, according to Amtrak’s latest monthly performance report. Considering that Amtrak’s April passenger-miles were nearly 91 percent as many in 2023 as 2019, this is a disappointing result. Since Amtrak ridership usually usually picks up in May due to increased vacationers, this suggests that Americans aren’t enthusiastic about riding trains for discretionary travel in a post-COVID world.

For detailed comments on transit and highways, see my July 12 post.

All three types of Amtrak trains underperformed in May, with Northeast Corridor trains carrying less than 88 percent of pre-pandemic riders, long-distance trains carrying 85 percent, and state-supported day trains carrying less than 81 percent. It is worth noting that Amtrak is putting most of the money it received for expansion in the infrastructure bill into state-supported trains even though they are the worst-performing part of its network. Amtrak’s reasoning is that Congress gave it money for capital improvements but not operating costs, so it will need to persuade the states to pay for operating costs of any new routes or increased frequencies. Continue reading

Transit’s Minuscule Share of 2021 Travel

Public transit carried 6.4 percent of 2021 motorized passenger travel in the New York urban area. It also carried 1.6 percent in Honolulu, 1.5 percent in San Francisco-Oakland, 1.4 percent in Seattle, 1.2 percent in Chicago, and 1.1 percent in Salt Lake City. In every other urban area it carried less than 1 percent; nationwide, transit carried just 0.7 percent of all motorized urban travel.

Chicago transit carried 1.2 percent, autos the other 98.8 percent of motorized passenger travel.

I calculated these numbers by comparing passenger-miles in the 2021 National Transit Database, which was released last fall, with daily vehicle miles of travel (DVMT) by urban area in table HM-72 of Highway Statistics, which was recently released by the Federal Highway Administration. To make the numbers comparable, I multiplied DVMT by 365 to get annual data and by 1.7 to account for vehicle occupancies, 1.7 being the result when dividing passenger-miles by vehicle-miles in Highway Statistics table VM-1. These numbers don’t include walking, bikes and e-bikes, or scooters, but they do include motorcycles. Continue reading

Transit Continues to Lag Behind Driving

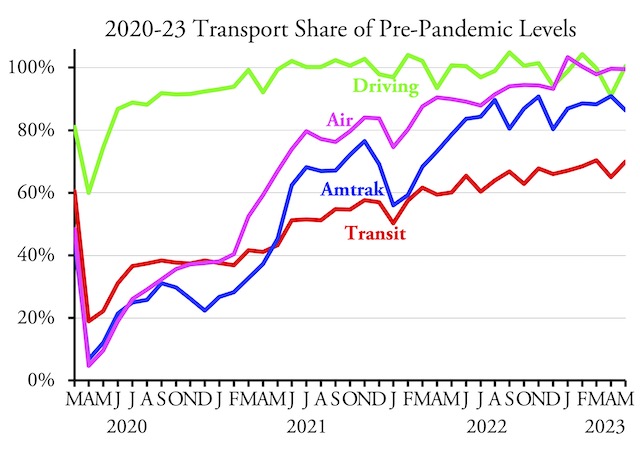
Americans drove more miles in May 2023 than the same month of 2019, according to data released by the Federal Highway Administration earlier this week. Transit ridership, however, was still less than 70 percent of 2019 levels, according to the Federal Transit Administration’s latest data.

At 69.9 percent of pre-pandemic levels, transit ridership was very close to 70 percent, a threshold it has breached only once since March 2020. To be fair, Cleveland’s regional transit agency is late in reporting ridership numbers. Though the agency carries only 0.3 percent of the nation’s transit riders, when its numbers are added, the national total for May will slightly exceed 70 percent of 2019. Continue reading

April Miles of Driving 91% of 2019

Americans drove 91 percent as many miles in April 2023 as they did in the same month in 2019, according to data released by the Federal Highway Administration yesterday. Relative to before the pandemic, driving hasn’t been this low since August 2020.

See last Wednesday’s post for a discussion of transit and air travel and last Thursday’s post for a discussion of Amtrak travel.

As I pointed out last week, April 2023 had two fewer business days than April 2019. But the number of business days seems to have less of an effect on driving than on transit. After all, commuters make up at least 40 percent of transit ridership but less than 20 percent of vehicles on the road. Driving in February, which has the same number of business days each year, was 104 percent of 2019 while driving in March, which had two more business days than in 2019, was 100 percent of 2019. Continue reading

Reordering of Cities

Jacksonville is now the nation’s 11th-most populated city, having overtaken San Jose in 2022. This is partly because Jacksonville grew by 1.5 percent since 2021, but also because San Jose lost 1.0 percent of its residents, according to Census Bureau estimates released earlier this week.

The new number eleven. Photo by Jon Zander.

Charlotte also overtook Indianapolis as the nation’s 15th largest city, partly because Indianapolis lost 0.2 percent of its residents but mainly because Charlotte grew by 1.7 percent. Las Vegas grew by 0.8 percent, overtaking Boston as the 24th largest city as the latter shrank by 0.6 percent. Continue reading

March Driving 99.9% of 2019

Americans drove 99.9 percent as many miles in March 2023 as in the same month in 2019, according to data released by the Federal Highway Administration on Friday. Rural driving was 4.1 percent greater than in 2019, and driving on urban interstates was 1.5 percent greater, but other urban driving was 3.1 percent less than in 2019, dragging down the overall average.

See May 5 post for discussion of transit, Amtrak, and airline travel.

I have to say I’m a little bit skeptical of these numbers. Throughout the pandemic, rural driving has been a bit ahead of urban, so that makes sense. However, urban interstate driving was generally behind other urban driving. Why is it suddenly ahead now? Continue reading