Transit’s Minuscule Share of 2021 Travel

Public transit carried 6.4 percent of 2021 motorized passenger travel in the New York urban area. It also carried 1.6 percent in Honolulu, 1.5 percent in San Francisco-Oakland, 1.4 percent in Seattle, 1.2 percent in Chicago, and 1.1 percent in Salt Lake City. In every other urban area it carried less than 1 percent; nationwide, transit carried just 0.7 percent of all motorized urban travel.

Chicago transit carried 1.2 percent, autos the other 98.8 percent of motorized passenger travel.

I calculated these numbers by comparing passenger-miles in the 2021 National Transit Database, which was released last fall, with daily vehicle miles of travel (DVMT) by urban area in table HM-72 of Highway Statistics, which was recently released by the Federal Highway Administration. To make the numbers comparable, I multiplied DVMT by 365 to get annual data and by 1.7 to account for vehicle occupancies, 1.7 being the result when dividing passenger-miles by vehicle-miles in Highway Statistics table VM-1. These numbers don’t include walking, bikes and e-bikes, or scooters, but they do include motorcycles. Continue reading

Transit Continues to Lag Behind Driving

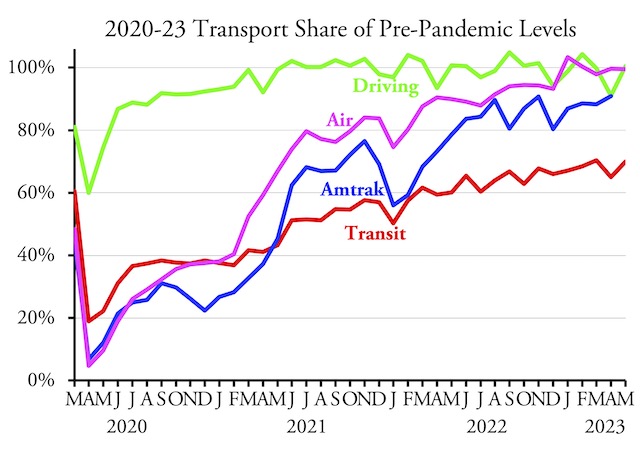
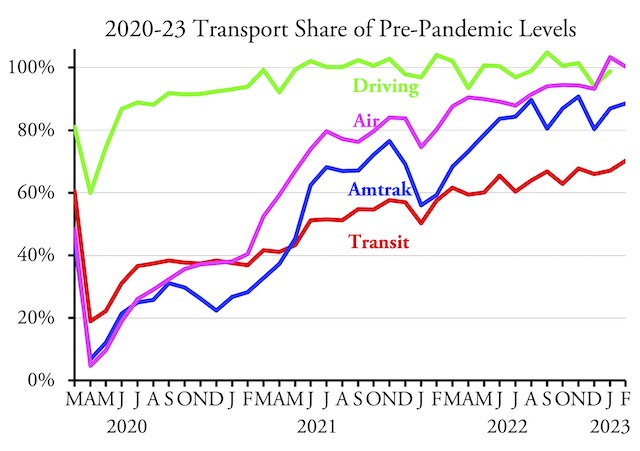
Americans drove more miles in May 2023 than the same month of 2019, according to data released by the Federal Highway Administration earlier this week. Transit ridership, however, was still less than 70 percent of 2019 levels, according to the Federal Transit Administration’s latest data.

At 69.9 percent of pre-pandemic levels, transit ridership was very close to 70 percent, a threshold it has breached only once since March 2020. To be fair, Cleveland’s regional transit agency is late in reporting ridership numbers. Though the agency carries only 0.3 percent of the nation’s transit riders, when its numbers are added, the national total for May will slightly exceed 70 percent of 2019. Continue reading

April Miles of Driving 91% of 2019

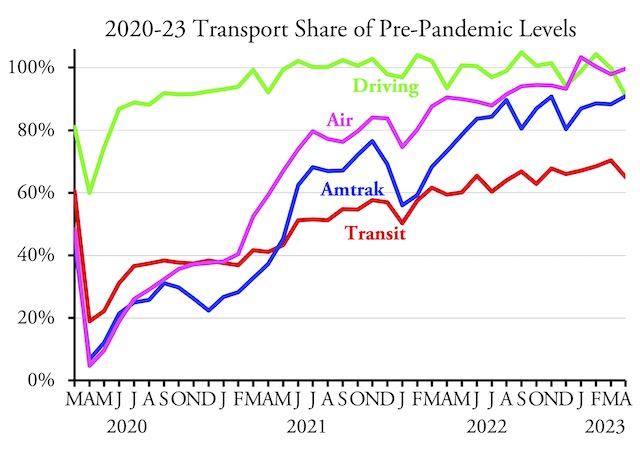
Americans drove 91 percent as many miles in April 2023 as they did in the same month in 2019, according to data released by the Federal Highway Administration yesterday. Relative to before the pandemic, driving hasn’t been this low since August 2020.

See last Wednesday’s post for a discussion of transit and air travel and last Thursday’s post for a discussion of Amtrak travel.

As I pointed out last week, April 2023 had two fewer business days than April 2019. But the number of business days seems to have less of an effect on driving than on transit. After all, commuters make up at least 40 percent of transit ridership but less than 20 percent of vehicles on the road. Driving in February, which has the same number of business days each year, was 104 percent of 2019 while driving in March, which had two more business days than in 2019, was 100 percent of 2019. Continue reading

Reordering of Cities

Jacksonville is now the nation’s 11th-most populated city, having overtaken San Jose in 2022. This is partly because Jacksonville grew by 1.5 percent since 2021, but also because San Jose lost 1.0 percent of its residents, according to Census Bureau estimates released earlier this week.

The new number eleven. Photo by Jon Zander.

Charlotte also overtook Indianapolis as the nation’s 15th largest city, partly because Indianapolis lost 0.2 percent of its residents but mainly because Charlotte grew by 1.7 percent. Las Vegas grew by 0.8 percent, overtaking Boston as the 24th largest city as the latter shrank by 0.6 percent. Continue reading

March Driving 99.9% of 2019

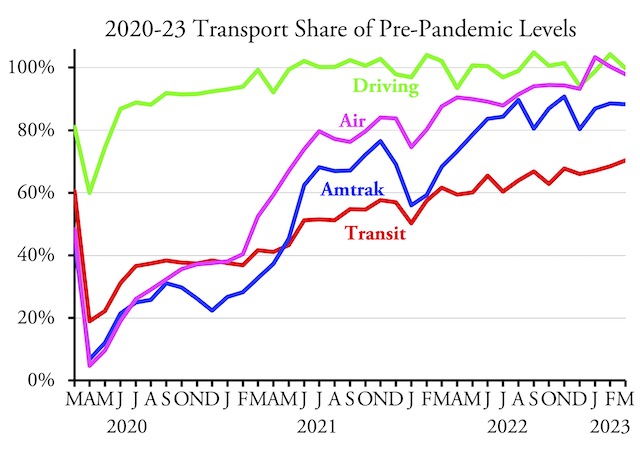
Americans drove 99.9 percent as many miles in March 2023 as in the same month in 2019, according to data released by the Federal Highway Administration on Friday. Rural driving was 4.1 percent greater than in 2019, and driving on urban interstates was 1.5 percent greater, but other urban driving was 3.1 percent less than in 2019, dragging down the overall average.

See May 5 post for discussion of transit, Amtrak, and airline travel.

I have to say I’m a little bit skeptical of these numbers. Throughout the pandemic, rural driving has been a bit ahead of urban, so that makes sense. However, urban interstate driving was generally behind other urban driving. Why is it suddenly ahead now? Continue reading

Transit Carries 70% of 2019 Riders in March

America’s transit systems carried 70.3 percent as many riders in March 2023 as in the same month in 2019, according to data released yesterday by the Federal Transit Administration. I reported last month that transit also carried 70 percent in February as in 2019, but that was due to a minor error that crept into my spreadsheet. The actual number was 68.5 percent, so transit is still gaining slowly compared with the pre-pandemic era. However, March 2023 had two more business days than March 2019, while the two Februaries had the same number, which is probably responsible for some of March’s improvement.

The Transportation Security Administration reports that 97.8 percent as many passengers passed through airport security in March 2023 as in March 2019. That’s down from the 100.3 percent in February. The actual number of passengers increased from 58 million to 72 million, but that’s just seasonal variations. Continue reading

2021 Transportation Subsidies

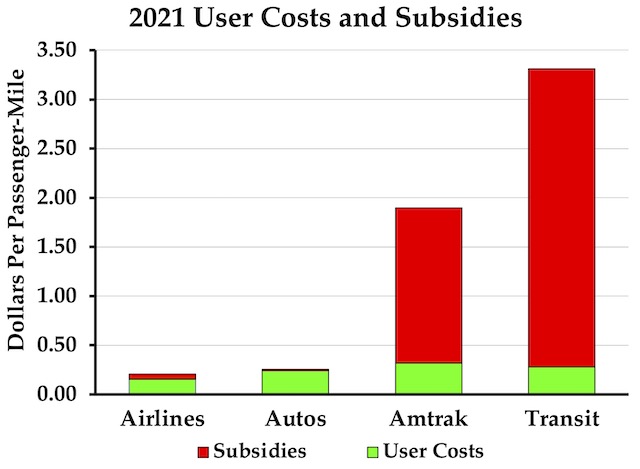
Government subsidies to all modes of transportation except highways greatly increased during the pandemic even as most passenger transportation declined. According to data recently released by the Department of Transportation, subsidies to driving rose 39 percent in 2021 than 2019, while subsidies to all other passenger modes increased by 180 to 350 percent.

Per passenger-mile subsidies to Amtrak were 30 times greater than subsidies to air travel in 2021, while per passenger-mile subsidies to transit were more than 230 times greater than subsidies to driving.

According to just-released table HF-10 from the 2021 Highway Statistics, government agencies spent $97.5 billion in property taxes and other general funds on highways in 2021, up from $80.3 billion in 2019. However, part of this expense was offset by diversion from highway user fees to transit and other non-highway activities. These diversions amounted to $38.1 billion in 2021, up from $33.3 billion in 2019. The net subsidy to highways, then, was $59.5 billion in 2021, up from $45.1 billion in 2019. Continue reading

Homelessness Down Since 2010, Up Since 2020

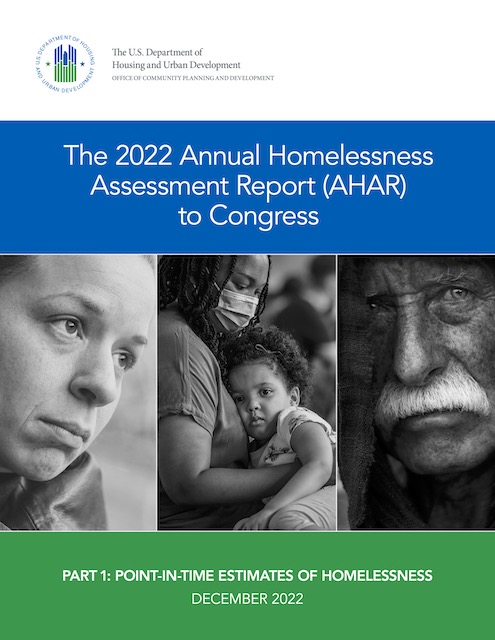
Nearly 600,000 Americans were homeless in 2022, according to a report recently released by the Department of Housing and Urban Development (HUD). The department has been attempting to count homeless numbers each year since 2007, and the latest numbers are based on counts made in January 2022.

Click image to download a 15.5-MB PDF of this 112-page report.

According to HUD’s counts, the total number of homeless people in the U.S. grew by nearly 2,000 between 2020 and 2022 — but that’s just 0.3 percent and easily within the margins of error of the counts. HUD also estimates the number declined by more than 54,600 between 2010 and 2022, which is large enough to be more likely. Continue reading

U.S. Drove 4.3% More Miles in 2/23 Than in 2/19

Americans drove 224.1 billion miles in February 2023, which was 4.3 percent more than in the same month in 2019, according to data released by the Federal Highway Administration yesterday. This was the biggest increase in driving over pre-pandemic levels since the pandemic began.

For more information on transit, Amtrak, and air travel, see Monday’s post.

Driving increased, relative to 2019, on all kinds of roads in both urban and rural areas. Urban driving was 2.5 percent greater than in 2019; rural driving was 10.2 percent greater. Continue reading

Transit Carries 70% of 2019 Riders in February

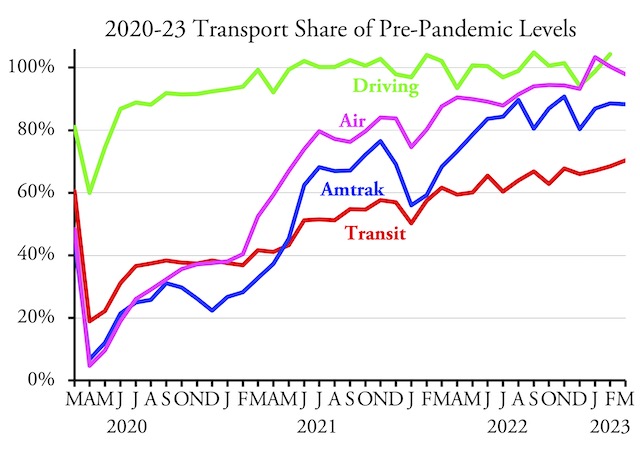
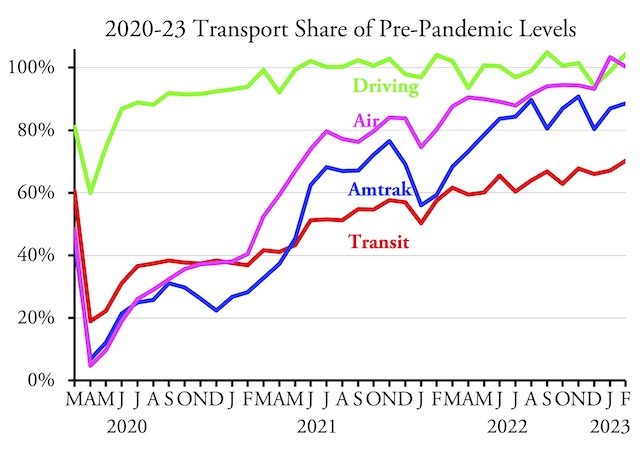
Public transit carried 70.2 percent as many riders in February 2023 as it did in the same month in 2019, according to data released by the Federal Transit Administration late last week. This is the first time ridership has exceeded 70 percent of 2019 numbers since February 2020.

The transit line on this chart has been updated to reflect the latest adjustments to the National Transit Database going back to late 2020.

Amtrak, meanwhile, reports that it carried close to 89 percent as many passenger-miles and the Transportation Security Administration reports that airlines carried more than 100 percent as many passengers in February 2023 as in February 2019. February highway data will be released later this month. Continue reading