Honolulu’s Terrible Folly & a Transit Mystery

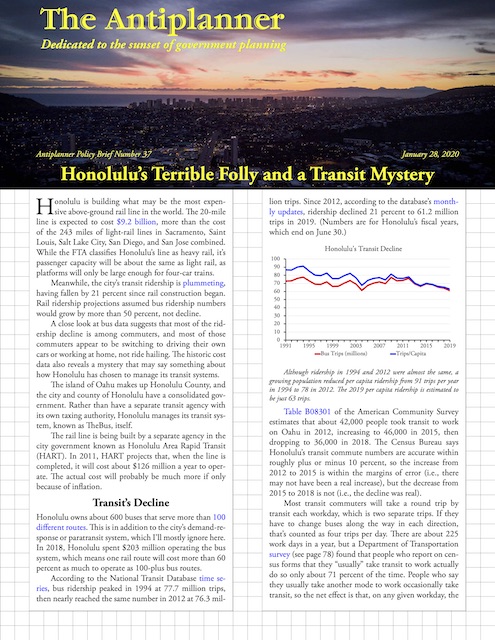
Honolulu is building what may be the most expensive above-ground rail line in the world. The 20-mile line is expected to cost $9.2 billion, more than the cost of the 243 miles of light-rail lines in Sacramento, Saint Louis, Salt Lake City, San Diego, and San Jose combined. While the FTA classifies Honolulu’s line as heavy rail, it’s passenger capacity will be about the same as light rail, as platforms will only be large enough for four-car trains.

Click image to download a four-page PDF of this policy brief.

Meanwhile, the city’s transit ridership is plummeting, having fallen by 21 percent since rail construction began. Rail ridership projections assumed bus ridership numbers would grow by more than 50 percent, not decline. Continue reading

Make America Affordable Again

The Department of Housing and Urban Development has asked for comments on eliminating regulatory barriers to affordable housing. This is my response.

Fifty years ago, housing was affordable everywhere in the country. The 1970 census found that the statewide ratio of median home prices to median family incomes was greater than 3.0 only in Hawaii (where it was 3.04). Price-to-income ratios were under 2.5 in every other state, and under 2.2 in California, New York, and other states that today are considered unaffordable.

Click image to download a five-page PDF of this policy brief.

A home that costs three times a family’s income is considered affordable because (depending on mortgage interest rates) the family can generally pay off a mortgage on that home in 15 years. When the home is four times the income, it can take 30 years, while families cannot pay off a conventional mortgage on a home that is five times their income. Higher home prices also mean higher down payments, which make housing even more unaffordable. Housing is in crisis today because price-to-income ratios have risen above 5.0 in California, Hawaii, and the District of Columbia, and above 4.0 in Colorado, Oregon, and Washington (calculated from tables B19113 and B25077 of the 2018 American Community Survey). Continue reading

Transit Capital vs. Operating Costs

Contrary to claims by many advocates of rail transit, the high capital cost of rail lines is rarely made up for by rail’s lower operating costs relative to buses. This can be seen from data in the National Transit Database’s annual time series capital use spreadsheet. This spreadsheet has capital costs for all transit agencies and modes dating from 1992 through 2018.

Click image to download a four-page PDF of this policy brief.

Capital funds are generally spent on things that last for many years while operating costs are spent mainly on one year’s activities. Thus, comparing them is difficult, but it is possible. This policy brief will make a first approximation for transit projects nationwide, but care must be taken in comparisons for specific projects. Continue reading

27 Quintillion Transit Charts

Last June, I posted a spreadsheet capable of producing more than a thousand charts about urban transit. This year, I’ve slightly outdone that with a spreadsheet capable of producing literally quintillions of different charts. This spreadsheet is an enhanced version of the National Transit Database’s time series spreadsheet for service data and operating costs.

Click image to download a four-page PDF of this policy brief.

As downloaded from the FTA web site, the raw spreadsheet is about 7 megabytes in size and has individual worksheets showing, for every transit agency and mode, operating costs (totals plus breakdowns into vehicle operations, vehicle maintenance, facilities maintenance, and general administration), fares, trips, passenger miles, vehicle revenue miles, vehicle revenue hours, directional route miles, and other data. All of these show annual numbers from 1991 through 2018 except for fares, which only go back to 2002. Continue reading

Urban Transit Is an Energy Hog

Transit is often touted as a way to save energy. But since 2009 transit has used more energy, per passenger mile, than the average car. Since 2016, transit has used more than the average of cars and light trucks together.

Click image to download a four-page PDF of this policy brief.

Automobiles and planes are becoming more energy efficient each year. But the annual reports of the National Transit Database reveals that urban transit is moving in the opposite direction, requiring more energy to move a person one mile in each of the last four years. Continue reading

Costs Up, Riders Down: 2018 Transit Data

Taxpayers spent nearly $3.75 billion more subsidizing transit in 2018 than the year before, yet transit carried 215 million fewer riders, according to the latest data released by the Federal Transit Administration. The increase in spending didn’t even translate to an increase in service, as transit agencies provided 44 million fewer vehicle miles of service in 2018.

Click image to download a four-page PDF of this policy brief.

In percentage terms, subsidies rose by 7.4 percent while ridership fell by 2.1 percent and vehicles miles of service fell by 0.9 percent. These numbers are from the 2018 National Transit Database, a series of 30 spreadsheets summarizing the annual performance of all of the nation’s transit agencies that have received federal support (which is nearly all of them). Numbers in the database are based on each agency’s fiscal year, so may not exactly agree with calendar year numbers calculated from the monthly updates. Continue reading

A Tale of Three Private High-Speed Rail Plans

Federal funding for high-speed rail is dead, at least for the duration of the Trump administration. But at least three private high-speed rail lines are under consideration, and backers say they will not seek any federal funds (other than, possibly, loans) to complete those projects. How likely are these projects to succeed?

Click image to download a four-page PDF of this policy brief.

Texas Central

The Texas Central proposes to build a new high-speed rail line between Dallas and Houston, the nation’s sixth- and seventh-largest urban areas and two of the fastest-growing regions in the country. The company says it plans to use Japanese Shinkansen trains to travel the 240 miles between the cities at top speeds of more than 200 miles per hour, resulting in an end-to-end journey of ninety minutes. Continue reading

Does Transit Capital Spending Boost Ridership?

Does spending a lot of money on transit improvements boost transit ridership? Since 1992, Dallas-Ft. Worth and Houston have each spent about ten times as much money on transit improvements as San Antonio and Austin. Transit systems in all four urban areas carry fewer riders today than they did in 2000. While Houston ridership has grown since 2012, it is because of a low-cost restructuring of its bus system, not because of transit capital improvements (e.g., new light-rail lines).

Click image to download a four-page PDF of this policy brief.

To find out whether it is generally true that spending more on transit can generate more riders, I gathered data for more than 100 of the nation’s largest urban areas. The not-so-surprising result is that spending more on transit improvements doesn’t do much to increase ridership. Moreover, the data indicate that urban areas that spend a lot on transit capital improvements don’t grow faster and may grow considerably slower than areas that don’t. Finally, the numbers show that increasing urban densities may have once had an effect on transit ridership, but doesn’t seem to anymore. Continue reading

Reducing Mobility to Boost Transit

Reeling from five years of ridership declines, the transit industry is stumbling around looking for a new mission, or at least new strategies to restore some of its revenues. New research and on-the-ground experience suggests the task will be difficult and may be hopeless.

Click image to download a four-page PDF of this policy brief.

The opening pages of the American Public Transportation Association’s (APTA) recently released 2019 Transit Fact Book present a cheery picture of transit’s success by comparing 2018 transit numbers with numbers from the 1990s, which saw historic lows in transit ridership. Yes, ridership grew from 1995 to 2014, but bus ridership peaked in 2008 and rail in 2014 and both have been declining since then, a reality APTA hopes people will overlook. This is typical of the kind of cherry-picking of data that transit advocates so often use to promote their agendas. Continue reading

Is Amtrak Guilty of Securities Fraud?

If Amtrak were a public corporation rather than a government-owned entity, a recent press release and other public statements by Amtrak officials would be considered securities fraud. According to the press release issued last week, fiscal year 2019 was Amtrak’s best year ever. The release claimed that operating revenues covered 99.1 percent of its operating costs, and Amtrak officials are so optimistic about the future that they predict the company will actually earn a profit next year.

Click image to download a three-page PDF of this policy brief.

Amtrak made these statements before it released its annual financial report (which is still not available), substituting instead an infographic. Moreover, the press release deliberately misrepresented the information that will eventually be published in that financial statement. Amtrak is counting on the fact that far fewer people will read the financial statement than the press release or news reports about that release. Continue reading