The Bureau of Transportation Deceptions

Last Friday, the Bureau of Transportation Statistics, which keeps track of all kinds of transportation, released 2020 data on government revenues and expenditures in transportation. The new data, however, are based on a radically altered definition of revenues and should be rejected.

Under the Bureau of Transportation Statistics’ new definition of revenues, transit revenues more than tripled and highway revenues nearly doubled.

The agency has kept track of this information for many years, with revenues being recorded in table 3-32 and expenditures in table 3-35 of an annual report called National Transportation Statistics. In the latest tables, the numbers go back to 2007, but in earlier editions (such as the 1995 edition), they go back as far as 1980 (in five-year intervals). Continue reading

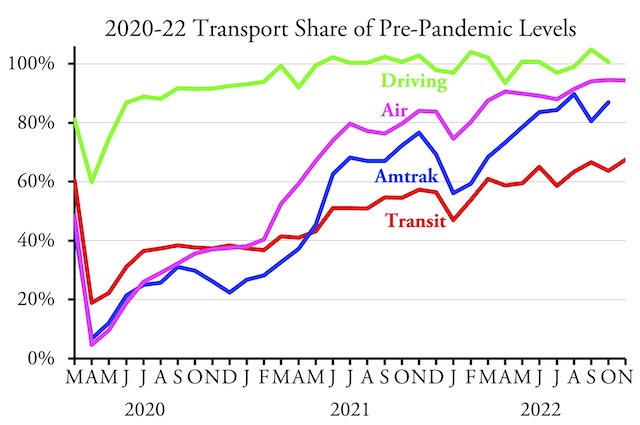
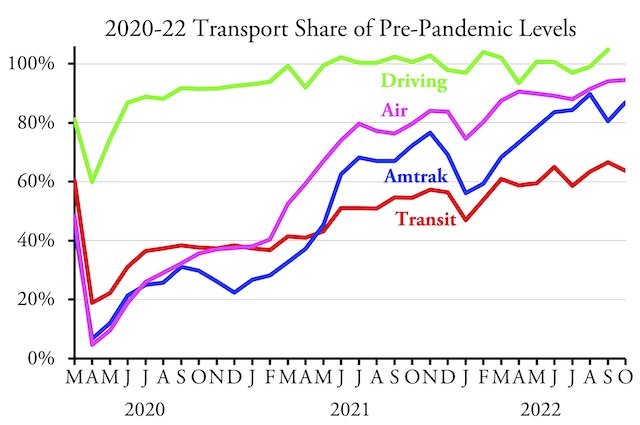
Transit Carries 67.5% of 2019 Riders in November

Transit ridership in November 2022 was 32.5 percent below November 2019, according to data released late last week by the Federal Transit Administration. This is in spite of the fact that November 2022 had one more work day than November 2019.

Amtrak and highway data are not yet available but this chart will be updated when they come out.

U.S. airlines saw 94.3 percent as many travelers in November as in the same month in 2019, down slightly from 94.5 percent in October. Amtrak data should be available soon; highway data seem to take a little longer. Continue reading

An Opportunity to Reinvent an Obsolete Industry

As illustrated by the tweet from Stanford economics professor Nick Bloom, it’s beginning to sink in that transit ridership is not going to recover to more than about 65 percent of what it was before the pandemic. However, instead of raising “concerns over the survival of public transit systems,” we should see this as an opportunity to reinvent an industry that was already obsolete years before the pandemic.

The 2021 National Transit Database reveals that many transit agencies are spending as much per rider as it would cost to send those riders in taxis, Uber, or Lyft. Counting both operating and capital costs, the average cost per light-rail trip was more than $40. Even just counting operating costs, the average cost per light-rail rider in San Jose was more than $53 and in Pittsburgh was almost $49. Continue reading

Sound Planning or Just Luck?

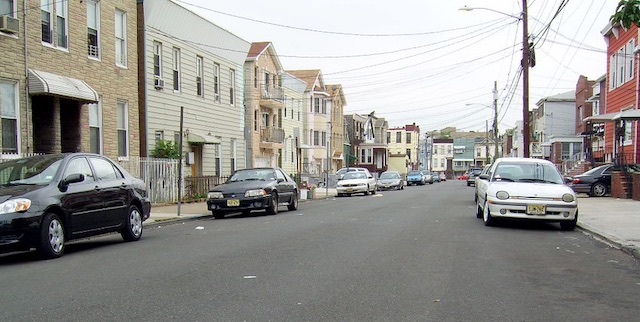
In 2018, Jersey City adopted Vision Zero, the goal of reducing traffic fatalities to zero. In the past year, it had zero fatalities on city-owned streets. Mission accomplished!

A street in Jersey City. Photo by schokker64.

A Bloomberg article yesterday breathlessly reviewed all the things the city did to reduce fatalities to zero, including roundabouts, road diets, bike lanes, lower speed limits, and the closure of one street to automobiles. Yet there isn’t any real evidence that any of these steps contributed to reduced fatalities. Continue reading

October Driving Greater Than in 2019

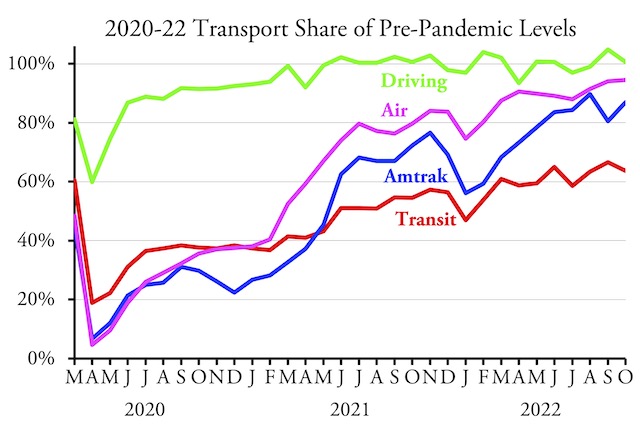
Americans drove 0.6 percent more miles in October 2022 than the same month in 2019, according to data released yesterday by the Federal Highway Administration. This is the second month in a row and the twelfth month in all that driving exceeded pre-pandemic levels since the pandemic began.

See previous posts for information about data from Amtrak and transit and air travel.

Driving exceeded 2019 miles in 26 states, while it fell short in 24 states and DC. The states that saw the greatest increase in driving, relative to October 2019 miles, were South Dakota (22.6%), Arizona (18.8%), Rhode Island (17.6%), Montana (15.4%), Missouri (11.2%), and South Carolina (11.1%). States that are still furthest from full recovery include California (-8.7%), Massachusetts (-8.0%), Delaware (-8.0%), Pennsylvania (-7.4%), and Maryland (-6.1%). Also, DC is -12.6%. Continue reading

Engines of Equality

A recent article in the New York Times is off-target when it calls automobiles “turbo-boosted engines of inequality.” The article points to some genuine problems, but those problems are not the fault of automobiles. Nor is “accessible public transportation” the solution, as the article claims in its conclusion.

The most egalitarian transportation since the first warlord tying a horse to the first chariot made fast transport accessible only to the elites. Image from 1985 Yugo brochure scanned by Tony DiGirolamo.

The truth is that automobiles are the most egalitarian form of transportation since walking. Horses, intercity trains, streetcars, you name it, were always used mainly by the relatively wealthy and were inaccessible to the poor, especially in cities. It was only when Henry Ford developed the moving assembly line that mechanized transportation became available to the vast majority of people. Continue reading

September Air Travel Exceeded 2019 Passenger-Miles

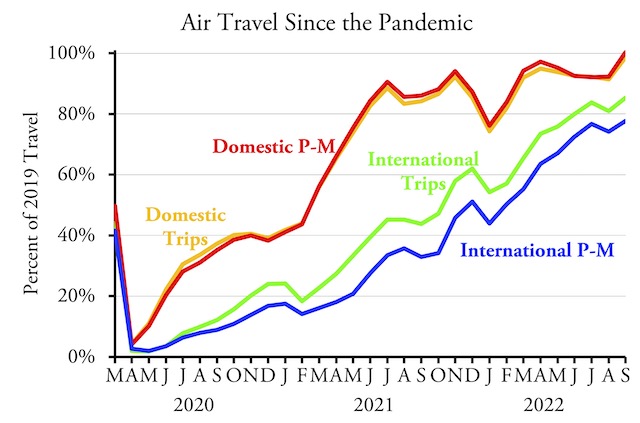
In September 2022, Americans flew more domestic passenger-miles than the same month in 2019, according to data released yesterday by the Bureau of Transportation Statistics. This is the first time domestic air passenger-miles have exceeded 2019 levels since the pandemic began.

Although the number of passenger-miles exceeded 2019 levels, the number of trips was only 98.7 percent of September 2019. This indicates that people are substituting other means of travel for some shorter airline trips. The effect, however, is smaller than I would have expected: the average domestic airline trip was 926 miles in September 2022 vs. 911 miles in September 2019, or 1.7 percent longer. For 2022 to date, average trip lengths were only 1.4 percent longer than in the first nine months of 2019. Continue reading

The Hill Family Trusts

This is a continuation of my posts about the Willamette Valley & Cascade Mountain Wagon Road.

Taking a page from his father’s example of the Minnesota mineral lands, Louis Hill turned his timber lands in Oregon into a trust. Louis, however, wasn’t as generous as his father. Instead of making Great Northern Railway stockholders the beneficiaries of the trust, he created the trust to provide a continuous income for his family. Actually, he made six trusts: one for each of his children, one for his wife, and one for himself. Each had a one-sixth undivided ownership of the timber lands. While the trusts were created in 1917, the lands earned no income for another two decades.


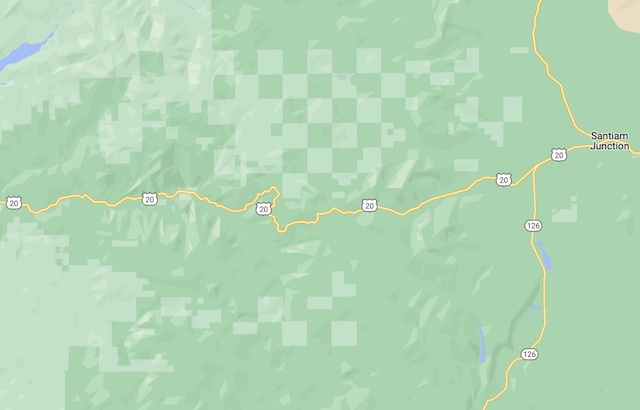
Congress’ policy of granting only every other square mile of land creates a distinctive checkerboard pattern. The dark green on this Google map is the Willamette National Forest while most of the light green squares are Hill trust forest lands. Highway 20 closely follows the route of the Santiam wagon road. Click here to see the same map in satellite view showing clearcuts on the Hill forest lands.

Shortly after Louis Hill acquired those timber lands, a forestry professor at UC Berkeley quit his job to start a forestry consulting firm in Portland. Dave Mason was a prophet of sustained yield forestry, which he described as “limiting the average annual cut to the production capacity” of a forest. This was in contrast to most timber land owners of the time, who generally bought land, cut the timber, and then let the land go for taxes. Continue reading

Amtrak Reaches 87% of 2019 Passenger-Miles

Amtrak carried almost 87 percent as many passenger-miles in October 2022 as it did in October 2019, according to the monthly performance report released by the state-owned company yesterday. This is a significant increase from the 80.5 percent recorded in September.

This is an update of a chart posted last week. I’ll provide another update when October driving data are available.

This is still short of the 94.5 percent carried by domestic and international airlines. Domestic air travel alone is even higher, but unfortunately those data are somewhat behind — the latest is for September, when domestic air travel was several percent higher than the average of domestic and international travel. Continue reading

Slow & Boring vs. Fast & Wasteful

Matthew Yglesias thinks that Amtrak’s latest “vision” is “slow and boring” and that Amtrak instead should spend money on high-speed trains in the Boston-Washington corridor. But Yglesias’ vision is no better; it might be faster, but it also means faster spending of money on worthless projects.

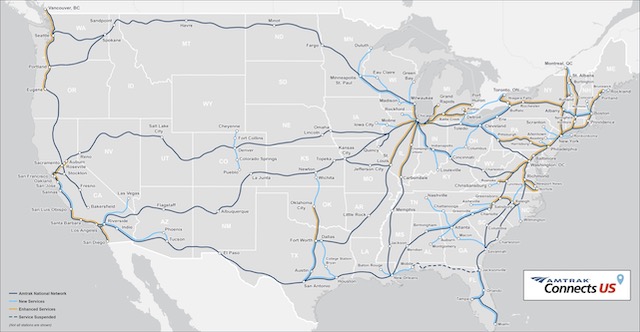
Amtrak’s 2021 “vision” for expanding its rail service. Click image for a larger view.

The first thing to note is that Amtrak’s latest plan is not so much a vision as it is a smorgasbord of pork barrel. Amtrak told the states, “We have this free federal money to spend; if you want some of it, draw some lines on a map where there are rail lines and maybe we’ll spend it there.” What Yglesias calls a vision is a taxpayers’ nightmare of idiotic rail projects. Continue reading