Who Benefits from Variable-Priced Road Tolls?

The Oregon Department of Transportation is planning to toll all lanes of major freeway in the Portland area soon. The San Francisco Bay Area Metropolitan Transportation Commission is considering tolling all freeways in the region later this decade. Plans such as these always raise charges that they will heavily impact low-income drivers.

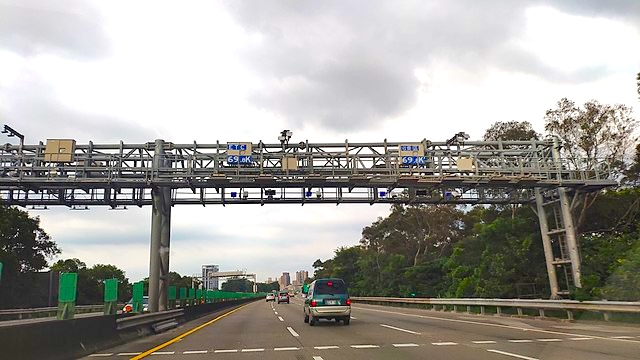
An electronic tollgate that collects tolls without slowing traffic. Photo by OnionBulb.

In response, the Antiplanner has argued that low-income people will greatly benefit from variable-priced tolling. While many taxes, including gas taxes, are regressive, tolling is not because people pay for only what they use. Congestion, however, is regressive because low-income people are less likely to be able to work at home or on flexible schedules that allow them to avoid rush hour. “If variable user fees can relieve that congestion, working-class people will be among the greatest beneficiaries.” Continue reading

September VMT Continues to Exceed 2019

Americans drove 1.4 percent more miles in September 2023 than in the same month in 2019, according to data released by the Federal Highway Administration yesterday. Vehicle miles of travel (VMT) have exceeded 2019 numbers in seven out of the last twelve months.

Most of the increase in driving was in rural areas. Although September’s rural driving was 4.6 percent greater in 2023 than 2019, urban driving was only 0.1 percent greater. The increase in urban driving was on collector and local streets; freeway and arterial driving were still a little short of 100 percent of 2019 miles. Continue reading

No Amount of Money Is Too Much

Is there any transit construction project that is so expensive that a transit agency will say, “Let’s not do this”? The Antiplanner has argued that the answer is “no”; instead, the only question agencies ask is, “Where are we going to get the money to do this?” Evidence for this view has recently come to light in San Francisco and Baltimore.

Architect’s model of the planned San Francisco transit center. Note the bottom level has commuter trains on the outer tracks and high-speed trains on the center tracks even though the prospects of high-speed rail ever reaching San Francisco are dimming every day.

Last January, I observed that the price of a 1.3-mile commuter-rail extension that San Francisco was planning had increased from $5.0 billion to $6.7 billion, or more than $5 billion a mile. I pointed out that there were several viable alternatives to spending what would be a record amount of money per mile on a transit project, including replacing the trains with buses or terminating the trains at a different location just seven minutes away. Now comes the news that the cost of the project has increased again to $8.25 billion, or more than $6.3 billion a mile. Continue reading

Transit Slowly Recovers

U.S. transit systems carried 73.9 percent as many riders in September 2023 as the same month in 2019, according to data released earlier this week by the Federal Transit Administration. This is transit’s highest level, as a percent of 2019 numbers, since the pandemic began. This is particularly remarkable as September 2023 had one less business day than September 2019.

Highway data for September 2023 are not yet available. This chart and post will be updated when they are released.

Transit was aided by the fact that September ridership in the New York urban area, where 46 percent of all transit rides take place, reached 78.6 percent of pre-pandemic numbers. Transit is also doing better than average in Los Angeles (79.3%), Miami (83.4%), Dallas (78.4%), and Houston (87.2%). Washington reached 73.8 percent, just slightly below the national average. Ridership continues to be below average in Chicago (63.1%), Philadelphia (59.4%), Atlanta (60.6%), Boston (64.0%), Phoenix (55.8%), and San Francisco-Oakland (64.4%), to name a few. Although transit ridership is slowly recovering, it is still well behind driving, which first reached 100 percent of pre-pandemic miles in June, 2021. Continue reading

Out for Growth

A new report on housing decries the fact that many unaffordable housing markets have gotten even less affordable in the last few years. The report’s solution is in the name of the organization that published it: Up for Growth, as in “grow up, not out.”

Click image to download a 24.0-MB PDF of this report.

The reports calls for cities to identify what neighborhoods to build in, “the appropriate increase in density for each location,” and the “optimal housing mix,” in other words, the mix of single-family vs. multifamily housing, for each neighborhood. Where people actually want to live and whether they prefer to live in single- or multifamily housing are not to be considered. Continue reading

States Shouldn’t Try to Reduce Per-Capita Driving

The most idiotic ideas come from articles written by anti-car writers. This isn’t recent, but a colleague from Washington let me know of a 2022 article from a “public interest” organization called the Frontier Group that reports that “less driving is possible.” Thanks to “compact neighborhoods” and “investments in infrastructure that supports walking, biking or riding transit,” some states have managed to reduce per-capita driving, which the Frontier Group regards as a victory.

To encourage transit while discouraging driving, Washington converted lanes on a bridge that had previously been open to all vehicles into light-rail lines. Image by Sound Transit.

As evidence, the author of the Frontier Group article, Elizabeth Redlington, compared miles of per capita driving by state in 1996 and 2021. Between those two years, some states increased but some declined and the biggest decline was in Washington state, which saw a 15.8 percent drop in per capita driving during that period. Continue reading

Joe Biden’s Dysfunctional Family

We’ve all heard of families where one person worked hard and made a lot of money, which attracted relatives eager to sponge off of that person’s wealth. Most would call such families dysfunctional because most of those family members should have been able to support themselves. Joe Biden’s family is like that.

An Amtrak train passes through Delaware. Photo by David Wilson.

I don’t mean Jill, Hunter, or any of his blood relatives. I mean Amtrak. As he himself has said, “The conductors, the engineers” on the trains then-Senator Joe Biden once regularly rode between Washington and Delaware “literally became my family.” Continue reading

The Case Against Affordable Housing

Affordable housing projects aren’t making housing more affordable. In fact, says a new study by an MIT economist, construction of new subsidized housing displaces new unsubsidized housing for little net gain in the housing supply. Specifically, the study found, ten new subsidized housing units resulted in eight fewer unsubsidized units.

This is supposed to be an affordable housing project, yet it is already unaffordable because it is six stories high, which costs at least twice as much to build, per square foot, as two-story construction.

Between 1950 and 1986, most subsidized housing was built by government agencies. In 1986, a Republican Congress sought to “privatize” the construction of subsidized housing by giving developers tax credits if they promised to rent their housing at below-market prices for 30 years. Today, low-income housing tax credits worth around $10 billion a year are given to the states to hand out to developers. To see how well this program is working, economist Evan Soltas looked at hundreds of projects built with tax credits. Continue reading

Why Bus-Rapid-Transit Has Become Popular

Am I ahead of my time or simply out of step with the times? When I began studying light rail, I quickly realized that buses could do everything light rail could do except cost a lot of money. I was especially heartened when Kansas City, whose voters had rejected light rail in something like eight different elections, spent about $3 million a mile (about $4 million a mile in today’s money) installing two bus-rapid-transit (BRT) lines and got 30 to 50 percent increases in ridership, which is more than some light-rail lines get.

So I should be happy about recent reports favoring BRT.

  • As noted above, the World Bank reports that “Bus Rapid Transit takes cars off the road and moves people quickly, providing the benefits of metros at a fraction of the cost.”
  • An article in Research in Transportation Economics found that the values of homes within a 20-minute walk of a bus-rapid transit station increased by 5 to 7 percent and the total increase in property values was six times the cost of the BRT projects.
  • Jarrett Walker reports “good outcomes” from a new BRT line in Portland, specifically a 30 to 40 percent increase in ridership.

Continue reading

32 Years of Transit Data

When the Federal Transit Administration released the 2022 National Transit Database, it also released updated time series data tables. These tables have operating data (including costs and ridership) from 1991 through 2022, capital costs from 1992 through 2022, and fare revenues from 2002 through 2022.

This chart shows ridership for six urban areas that I consider to be basket cases, with ridership steadily declining despite — or more likely because of — the construction of light-rail or some other transit infrastructure. Of course, ridership declined everywhere due the pandemic, but most of these are among the slowest to recover to their already low 2019 levels.

The release includes six data tables, but I find just two of them useful as they are the only two that break down data by mode. Table TS3.1 has capital costs by transit agency and mode. Table TS2.1 has all other information — operating costs, fares, service in miles and hours, ridership, passenger-miles, and miles of rail lines — by agency and mode. Continue reading