Search Results for: plan bay area

How New Starts Harms Transit Riders

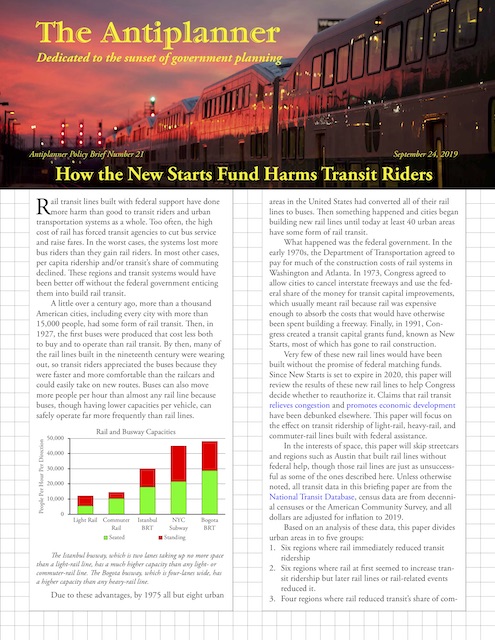
Rail transit lines built with federal support have done more harm than good to transit riders and urban transportation systems as a whole. Too often, the high cost of rail has forced transit agencies to cut bus service and raise fares. In the worst cases, the systems lost more bus riders than they gain rail riders. In most other cases, per capita ridership and/or transit’s share of commuting declined. These regions and transit systems would have been better off without the federal government enticing them into build rail transit.

Click image to download a 6-page PDF of this policy brief.

A little over a century ago, more than a thousand American cities, including every city with more than 15,000 people, had some form of rail transit. Then, in 1927, the first buses were produced that cost less both to buy and to operate than rail transit. By then, many of the rail lines built in the nineteenth century were wearing out, so transit riders appreciated the buses because they were faster and more comfortable than the railcars and could easily take on new routes. Buses can also move more people per hour than almost any rail line because buses, though having lower capacities per vehicle, can safely operate far more frequently than rail lines. Continue reading

Congestion Is a Problem, Not a Solution

Phoenix has seen the least increase in congestion of any major urban area in America. According to the data set accompanying the Texas Transportation Institute’s recently released 2019 Urban Mobility Report, the average commuter in Phoenix suffered from 80 hours of delay in 2017, up 26 hours from 1982. That compares with an 82-hour growth in delay per commuter in the San Francisco and Washington urban areas and an average 53-hour increase in delay for the nation’s top 50 urban areas.[*]

Click image to download a four-page PDF of this policy brief.

Phoenix’s relatively small increase in traffic congestion is largely due to the massive increase in freeways in the region. According to an earlier edition of the urban mobility report, Phoenix had 210 lane-miles of freeways in 1982, growing to 2,015 by 2017. Part of this increase was due to an expansion of the urban area, leading to the addition of freeways that already existed but were previously outside the urban area. But the region has little more than doubled in land area since 1982 while the freeway lane-miles increased by nearly ten times. No other region has seen such a large increase in freeway lane-miles. Continue reading

12. Graduate School

As a student at the University of Oregon, my main source of income was a federal program called work-study. The federal government paid 80 percent of the wages for part-time student employees, and non-profit organizations willing to pay the other 20 percent were eligible to hire students under the program. I received a call from Dave Brown, an assistant director of the Survival Center, an on-campus environmental group, asking me to work for them writing reviews of Forest Service plans.

The Survival Center was located in the latest, 1973 addition to U of O’s student union. I had office space, a desk, an IBM Selectric typewriter to write on, and a phone that was hooked into the state telephone network, allowing me to make unlimited calls to any city that had a state college or university. Although I rented a small room in a house in nearby Springfield for, as I recall, $55 a month, the Survival Center became my real home, and initially I only left because the building was closed to students after 11 pm. Later, they allowed students with a key to stay after 11 and I sometimes would work there until 2 or 3 in the morning.

I continued my cycling advocacy in a small way. Part of the cycling route between Eugene and Springfield was on a designated bike path that emptied onto a city street in Springfield. The city of Springfield had decided that it was too dangerous to let cyclists ride in the street and required that they use the sidewalk. The sidewalk wasn’t very wide and had something like 40 driveway cuts, each one requiring bicycles to go down a dip and then up a bump. Sometimes part of the sidewalk was blocked by signposts and it often had wet leaves, litter, and other obstacles. Continue reading

11. A Few Cases

Growing up in Portland, I was taught that the city had the cleanest water in the world because it came from a watershed on the Mount Hood National Forest that had been set aside exclusively for Portland’s use. The Bull Run Trespass Act of 1904 closed the 102-square-mile Bull Run Watershed, along with a 41-square-mile buffer around it, to all public entry, and only Forest Service officials and employees of the Portland water bureau were allowed to enter the area.

This belief was so well known that a medical doctor named Joseph Miller bought a piece of land on the edge of the buffer strip and built a home. There he and his wife lived for many years, content in the knowledge that behind their house was 143 square miles of pristine wilderness that, unlike most wilderness, wasn’t even open to public recreation.

I was in Corvallis studying forestry when this myth came tumbling down in the form of a landslide in 1971. Portlanders woke up one morning to find their “pristine” water to be muddy brown, and they were advised to boil it before drinking it (as if anyone would want to drink brown water). The Forest Service hastened to announce that the landslide that had polluted the city’s water wasn’t caused by one of the clearcuts in the watershed. What it didn’t say was that the landslide was caused by a road leading to one of those clearcuts. Continue reading

9. Ranking the Best & Worst Transit Agencies

The nation’s worst-managed transit systems lose 65 cents for every dollar they spend on operating costs, fill only 42 percent of their seats, carry the average urban resident just 40 round trips per year, use more energy and spew out more greenhouse gases per passenger mile than the average car, carry fewer than 14 percent of low-income workers to work, and lost 4 percent of their customers in the last four years.

Click image to download a PDF of this policy brief.

Oops — excuse me. Those are the numbers for the nation’s five best transit systems outside of New York (which is in a class by itself). The five worst systems, out of the nation’s fifty largest urban areas, lose 87 cents for every dollar they spend on operating costs, fill under 18 percent of their seats, carry the average urban resident less than four round trips per year, use more energy and spew out more greenhouse gases per passenger mile than the average Chevy Suburban, carry less than 2 percent of low-income workers to work, and lost more than 13 percent of their customers in the last four years. Continue reading

6. 1,080 Transit Charts in One Spreadsheet

Policy briefs four and five included several charts showing transit’s decline in Austin. To help visualize what is happening to transit in other urban areas, I’ve made a spreadsheet that creates eleven different charts for any of nearly 100 urban areas. Among other things, these charts show ridership, trips per capita, costs, environmental impacts, transit’s share of commuting, and changes in the incomes of transit commuters.

Click image to download a four-page PDF of this policy brief.

The dataset includes the nation’s 100 largest urban areas. Because of the transit controversy in Durham, which as of 2010 was only the 110th largest urban area, I included it on the list as well. Continue reading

5. OSPIRG Intern Part 2

One of the requirements for graduating from the Oregon State School of Forestry was that students had to spend at least one summer working for a forestry company or agency. On application, the school agreed that work studying forest policy for OSPIRG would qualify. Since my 1972 internship earned so much publicity, OSPIRG was happy to hire me again for the summer of 1973 and to put me to work on a forestry project.

I wanted to study the Forest Service but OSPIRG asked me to study the Bureau of Land Management (BLM) instead. While I was still in school in Corvallis, OSPIRG’s main office in Portland had been visited by a strange man named Robert Bradley Jones who was concerned about BLM lands in western Oregon. He had written a book called One by One which told the sordid story of how Congress had given every other square mile of land between Portland and the California border (as well as between Roseburg and Coos Bay) as grants to the Oregon & California Railroad and wagon road builders and then took them back when the railroad failed to comply with the terms of the grant. Known as the O&C lands, these revested land grants represented less than 1 percent of the area managed by the BLM but produced something like 90 percent of its timber.

In 1937, Congress had written a law directing the Secretary of the Interior to manage the O&C lands for timber on a sustained yield basis, probably the first time Congress had used the term “sustained yield” in a law. The law also directed the secretary to give 75 percent of the revenues to the counties in lieu of the property taxes the counties would have collected had the lands been private. Most of the counties had agreed to give a third of their share of the funds to the BLM to pay for roads, reforestation, and other costs of accessing and managing the timber. They reasoned that, if the BLM didn’t have any money, it couldn’t sell much timber, so 50 percent of a lot of sales would be better for the counties than 75 percent of not much. Continue reading

Americans on the Move

Maricopa County (Phoenix) was the nation’s fastest-growing county in 2018, gaining more than 81,000 new residents from 2017, according to population estimates just released by the Census Bureau. A distant second was Clark County (Las Vegas), at 48,000 new residents; followed by Harris County (Houston), 34,000; Riverside County (California), 33,500; and King County (Seattle), 29,000. Since 2010, Maricopa gained 593,000 residents and was just edged for the number one spot by Harris County, which grew by 605,000.

Just as significant are the counties that lost population, led by Cook County (Chicago), which lost 24,000 people. Three New York City boroughs are in the bottom five: Queens (-18,000), Brooklyn (-13,500), and the Bronx (-7,500). Los Angeles County is also in the bottom five, having lost 13,000. Baltimore, Honolulu, St. Louis, Cuyahoga (Cleveland), and Sonoma Counties are also big losers, the latter due to wildfire issues.

As a result of these county changes, the nation’s three largest metropolitan areas all lost population: New York (-25,000), Chicago (-22,000), and Los Angeles (-7,000). The declines in the central counties of these regions were partly offset by gains in suburban counties. The metro areas with the biggest gains were Dallas-Ft. Worth (132,000), Phoenix (96,000), Houston (92,000), Atlanta (76,000), Orlando (60,000), and Seattle (55,000). Continue reading

Transit Ridership Falls Again in February

America’s transit systems carried 4.7 percent fewer riders in February 2019 than the same month in 2018, according to data released last Friday by the Federal Transit Administration. All major forms of transit saw declines except hybrid rail, which grew because of a new San Francisco Bay Area line that opened in mid-2018. Overall, rail and bus each declined by 4.7 percent.

Ridership dropped in 39 of the nation’s 50 largest urban areas. The biggest declines were in Providence (-15.9%), Milwaukee (-14.3%), Louisville (-13.0%), Detroit (-11.1%), Kansas City (-11.0%), Phoenix (-10.8%), and Philadelphia (-10.2%). Ridership even declined in Seattle (-5.8%), which had been enjoying a sustained period of growth.

The biggest ridership growth was in Richmond (12.6%), testimony in favor of that transit system’s redesign with the help of Jarrett Walker. Ridership also grew significantly in Dallas-Ft. Worth (12.2%), Denver (5.3%), Austin (5.2%), Buffalo (4.5%), Atlanta (2.8%), and Salt Lake (2.3%). Ridership also grew by less than a percent in Houston, Washington, Tampa-St. Petersburg, and San Juan. Continue reading

Fantasy vs. Reality

Last week, the Antiplanner participated in a conference on the future of transportation in southern California. The conference consisted of four panels: high-speed rail, congestion, finance, and experiences in other countries. Since they invited me, I assumed the conference would offer a balance of pros and cons on the various issues. It turned out I was the only skeptic of passenger rail and giant subsidies to transit.

The high-speed rail panel opened with a statement by the moderator that the state has to build high-speed rail because there is no way that the airlines could handle the projected growth in travel between the Bay Area and southern California. Really? Most of the planes in that corridor today are 737s or smaller; a switch to 757s or similar-sized planes would instantly increase capacity by 50 percent or more.

The first formal presentation was by Dan Richard, who chaired California’s High-Speed Rail Authority from 2012 until being replaced by Governor Gavin Newsom last month. Richard noted that, as of 2008, the year California voters approved selling $9 billion worth of bonds for high-speed rail, China only had one high-speed rail line that was about 250 miles long. Since then, in the time it has taken California to complete no lines, China has opened nearly 18,000 miles of lines. Continue reading