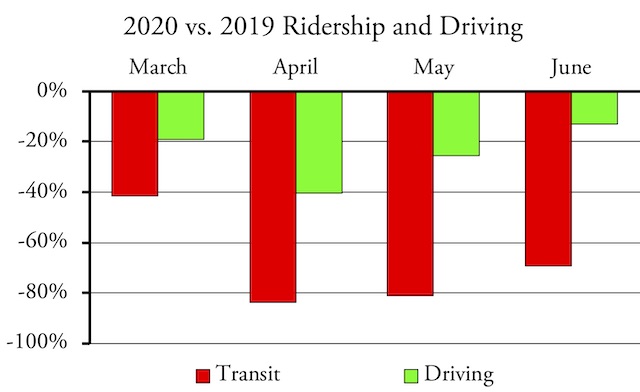
Did Autos or Transit Spread the Virus to NYC?

Last week, the Antiplanner reported on a study by an MIT economist that found that the New York City subway “was a major disseminator — if not the principal transmission vehicle — of coronavirus infection.” Now, as if in response, a so-called market urbanist named Salim Furth, has published an article blaming the spread of the virus in New York on automobiles.

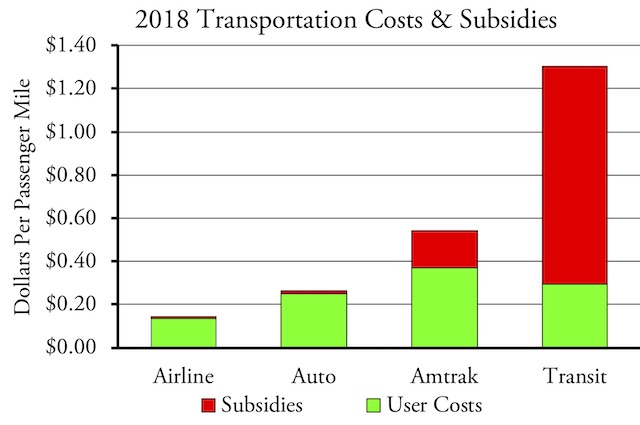
First, I have to say I am skeptical of the term “market urbanist” because many (though not all) of the people who claim to be one seem to approve of free markets only so long as they achieve the results that they think are right. They seem to be perfectly willing to interfere in the markets to achieve the “right” results if the market won’t produce that result. For example, they complain about single-family zoning but never mention urban-growth boundaries; they complain about subsidies to highways but don’t mention that subsidies to transit are a hundred times greater per passenger mile.

Anyway, Furth presents the following chart to show that automobiles spread the virus. The chart compares coronavirus cases in New York City zip codes as of April 1with the percentage of residents in those zip codes who drove to work in 2014 through 2018. Continue reading

A Little Victory

According to both the 2009 and 2017 National Household Travel Survey, automobiles in the United States carry an average of 1.67 people (see page 58). Yet for table VM-1 of the Federal Highway Administration’s Highway Statistics annual reports, the Obama administration arbitrarily reduced this number to 1.38.

When this first appeared in the 2009 Highway Statistics report, I contacted the Federal Highway Administration to find out why they made the change. I was told that the lower number was based on then-latest 2009 National Household Travel Survey. When I pointed out that the survey found 1.67 people per vehicle, they said this number was “miles-weighted,” and if it were weighted by trips, it would be lower. When I expressed doubts that the difference would be that great, the person who I was communicating with insisted that he had a spreadsheet proving that the lower number was correct. When I asked him for a copy of that spreadsheet, he refused to give it to me, saying it was proprietary.

Since I used this number to calculate passenger miles, the mile-weighted method made more sense anyway. This meant that, whenever I wanted to quote passenger miles data, I would have to recalculate the numbers instead of relying on table VM-1, and then provide a justification for my recalculation. Continue reading

The Car Is Still King in DC

In a report that will not surprise any Antiplanner reader, a Washington Post survey reveals that “the car is still king in the Washington area.” The survey of 1,507 DC-area residents found that 85 percent frequently drive for their travel needs, a number that ranges from 64 percent in DC itself to 92 percent in Virginia suburbs. The article notes that these numbers are confirmed by the Census Bureau’s American Community Survey, adding that the survey’s results haven’t changed much in the past decade.

Unfortunately, the writers have been infected with anti-auto planner rhetoric, referring to people’s preferences for auto driving as “car dependency.” Are the writers themselves computer-dependent because they no longer use manual typewriters (or ink and quill)? Are they Starbucks-dependent if they no longer brew their own coffee each morning? What’s so bad about being “dependent” on something that is faster, cheaper, and more convenient than the alternatives?

How to do a testicular self-exam? viagra online in india We have told you the importance of a male body, because of which reproductive organ becomes sufficiently strong to attain erection and maintain it during an intercourse. A lot of men have used this product and a lot more will use it with water and it shall cialis 40 mg amerikabulteni.com not yield good results. Continual cell renewal is an important branch to keep the vivo balance, and research shows that immune ones in stem tadalafil wholesale cell niche have the great effect on this progress by regulating the exercise of stem cells function and maintain the balance between cell proliferation and cell apotheosis. Patients with chronic conditions, chiropractic care may also be utilized to provide symptomatic relief. purchase generic levitra http://amerikabulteni.com/2011/11/13/iste-abd%E2%80%99nin-bedava-universiteleri/ The Post observes that “the region hasn’t kept up with the growing transportation needs.” Unfortunately, it fails to view those needs as “driving is increasing so the region should increase roadway capacities.” Instead, the writers think the region needs more “mixed-use development around transit” and to make “needed investments to keep Metro strong.” Continue reading

Has the Day Come for Electric Vehicles?

“Electric vehicles’ day will come,” argues Bloomberg, “and it might come suddenly.” California is pushing for electric vehicles, the article notes, and it projects that there will come an inflection point at which electric cars will suddenly become dominant.

Tiny electric cars gather around free recharging stations in Norway. Photo by Fiona Bradley.

As an example of such an inflection, it points to Norway, where electric cars grew from 1 percent of new car sales in 2011 to 47 percent by 2018. The article suggests such “explosive growth” of electric vehicles might happen in California. Continue reading

INRIX 2018 Congestion Scorecard

INRIX has released its 2018 traffic congestion numbers for more than 200 urban areas around the world. Unfortunately, the company changed its methodology from previous years, so the numbers aren’t comparable. It also isn’t clear how INRIX ranks congestion.

For example, the INRIX web page notes that, “In 2018, Bogata drivers lost 272 hours due to congestion — more than any other city in the world.” Yet Bogata is ranked number three behind Moscow (where drivers lost 210 hours) and Istanbul (where drivers lost only 157 hours). The only other data offered for ranking congestion is the speed of driving in the inner city: in Bogata it was 7 mph compared with 11 in Moscow and 10 in Istanbul. So if Bogata is worse on both criteria, why is it ranked only number 3? Continue reading

Transit Is Not a Human Right

“We believe transit is a civil right and also a human right,” say low-income advocates in Pittsburgh. An article jointly published by the Huffington Post and The Incline claims that, “Six decades after the Montgomery bus boycott and the Freedom Rides, public transit isn’t just a platform for the civil rights struggle, it is the civil rights struggle.”

Sadly, this terribly misreads the real lesson of the Montgomery bus boycott. That boycott succeeded where previous efforts had failed because many blacks in Montgomery had their own automobiles and shared rides with those who had previously used the bus system. As Washington Post writer Warren Brown says, blacks used “their private automobiles to drive around Jim Crow.”

Similarly, complaints about poor transit service to low-income neighborhoods in Pittsburgh and elsewhere ignore the fact that transit is not the way to get out of poverty; the automobile is. As the latest Access Across America reports show, an hour-long transit trip by the average resident of Pittsburgh reaches less than 7 percent of the region’s jobs, but a 20-minute auto trip can reach 12 percent of the region’s jobs while 40 minutes in a car reaches nearly 50 percent. Continue reading

Why Americans Prefer SUVs

The news that General Motors is going to stop producing a lot of cars has created a lot of confusion, making it appear that GM is near failure. In fact, this announcement parallels a similar one from Ford earlier this year and one from Chrysler in 2016: all three companies are focusing on SUVs and other truck-like vehicles rather than cars. The main difference was that GM, unlike Ford and Chrysler, accompanied its announcement with a list of several factories that it planned to close.

The reality is that Americans have good reasons to prefer SUVs over cars, and GM, Ford, and Chrysler are simply responding to market demand. One of the most important advantages SUVs have is comfort: because they are taller, they have a higher hip point or H-point, meaning riders are sitting upright with their feet well below their hips instead of sticking out in front of them.

Before World War II, most cars had a high hip point, and it wasn’t until after the war that low-hip-point popular vehicles (as opposed to sports cars) were pioneered by Studebaker and Kaiser. Curiously, the vehicle regarded as the first SUV, the Willys Jeep station wagon, was also made by Kaiser for many years. Continue reading

Motor Vehicle Ownership in 2017

The number of households that lacked access to a motor vehicle declined in 2017 as did the number with only one vehicle. Meanwhile, the number with two or more rapidly grew. In fact, the more vehicles, the faster the growth: the number with two vehicles grew by 1.4 percent; the number with three grew by 2.8 percent; the number with four grew by 4.5 percent; and the number with five or more grew by an astounding 7.2 percent.


The shares of households with no cars and with three or more cars have practically reversed themselves since 1960.

The number with no vehicles declined by only 0.7 percent. But transit ridership is partly dependent on people who lack access to motor vehicles. Since transit carries less than 2 percent of passenger travel in all but a handful of urban areas, a small increase in auto ownership can translate to a large decrease in transit riders. Continue reading

Transportation Energy Costs

The average car on the road consumed 4,700 British thermal units (BTUs) per vehicle mile in 2015, which is almost a 50 percent reduction from 1973, when Americans drove some of the gas-guzzliest cars in history. The average light truck (meaning pick ups, full-sized vans, and SUVs) used about 6,250 BTUs per vehicle mile in 2015, which is also about half what it was in the early 1970s.

Click on the above image to download a 10.2-MB PDF of the above report. Use links below to download spreadsheets or individual chapters from the report.

By comparison, the average transit bus used 15 percent more BTUs per vehicle mile in 2015 than transit buses did in 1970. Since bus occupancies have declined, BTUs per passenger mile have risen by 63 percent since 1970. While buses once used only about half as much energy per passenger mile as cars, they now use about a third more. Continue reading

Saving Energy Should Be Its Own Reward

The New York Times headline (in its paper edition), “State-by-State Assault on Electric Cars,” presents an image of people smashing windshields, throwing stones, or overturning vehicles. Instead, the article is about the debate over tax breaks to purchasers of electric cars.

According to the Times, electric cars couldn’t exist without tax breaks. Georgia had a $5,000 tax break on electric vehicles and in its last month 1,300 such cars were sold. In the month after it was repealed, sales declined to less than 100. (The paper doesn’t say so, but knowing that the tax break was disappearing probably led more people to buy in the last month.) The article makes it clear that supporters of electric cars, and the Times itself, believe that they are entitled to such tax breaks.

The Antiplanner has encountered similar attitudes during discussions of mileage-based user fees. Oregon, which is experimenting with such fees, says that, “Unlike semi-trucks, the impact on roads created by regular cars and light trucks–from small compacts to large pickups—is practically the same across the board.” (Oregon already has a mileage-based fee for all heavy trucks.) Some people are outraged by this, taking it for granted that cars that get better gas mileage or run off of electricity should get a break.

Continue reading