Transforming Regressive Taxes into Profits

Just once, I’d like to see a regional transportation plan that didn’t try to transform the region into some planner’s fantasy of how people should live but instead tried to serve the actual transportation needs of the people who lived there. Unfortunately, given that the federal government is giving out tens of billions of dollars for “transformative” projects, we are mainly seeing plans whose only real transformations will be to make some rich people richer and most poor people poorer.

Click image to download a 13.0-MB PDF of this 346-page draft regional transportation plan for Baltimore.

I bring this up because of an op ed earlier this week by two Baltimore-area politicians promoting that region’s $70 billion plan which, they promise, will produce “transformative changes to our transportation system.” More than half of the capital projects in the plan will be for urban transit, including the Red light-rail line that had previously been rejected as a waste of money as well as another, even more-expensive light-rail line. Continue reading

U.S. Drove 4.3% More Miles in 2/23 Than in 2/19

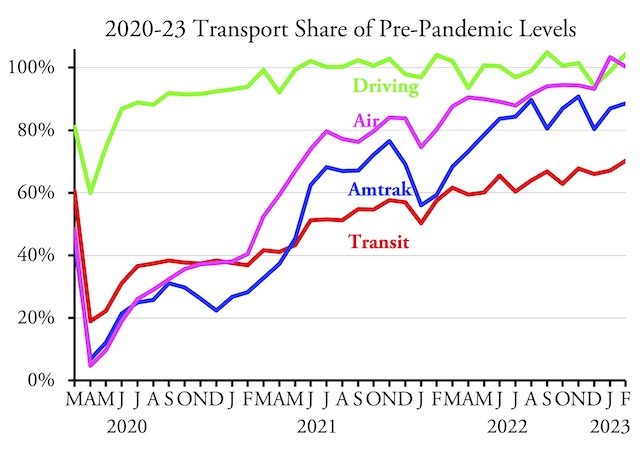
Americans drove 224.1 billion miles in February 2023, which was 4.3 percent more than in the same month in 2019, according to data released by the Federal Highway Administration yesterday. This was the biggest increase in driving over pre-pandemic levels since the pandemic began.

For more information on transit, Amtrak, and air travel, see Monday’s post.

Driving increased, relative to 2019, on all kinds of roads in both urban and rural areas. Urban driving was 2.5 percent greater than in 2019; rural driving was 10.2 percent greater. Continue reading

Vision Zero Accomplishes Zero

Cities across the country have passed Vision Zero plans that resolve to reduce accident fatalities to zero by 2030. Planners seem to think that if we resolve strongly enough, and maybe cross our fingers, these plans will work.

Photo by Alextredz.

To be fair, the plans do more than resolve. Most of them focus on slowing down traffic, either by reducing speed limits or by narrowing lanes, installing traffic circles, or taking other steps to force drivers to slow down. This is based on the obvious proposition that someone hit by a car going 20 miles per hour is less likely to die than someone hit by a car going 50 miles per hour. Continue reading

The Most Congested Cities

The most congested urban area in America in 2022 was Chicago, where the average auto commuter lost 155 hours to traffic delays. That was only one hour less than London, the most congested urban area in the world, or at least the most congested city evaluated in the latest INRIX global traffic scorecard.

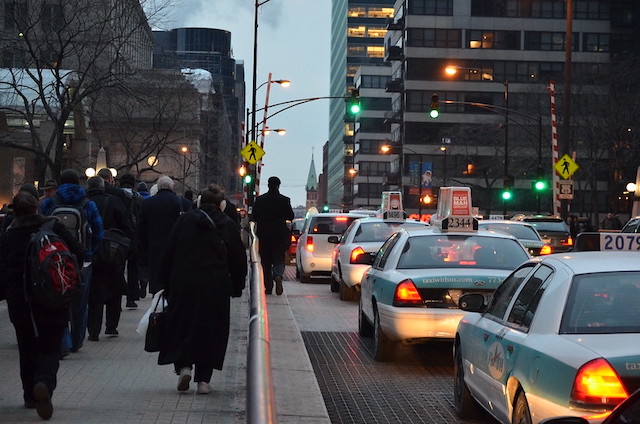
Prior to the pandemic, more than half the people who worked in downtown Chicago took transit to work, but the city was still very congested and — according to INRIX — is even more congested today. Photo by Michael Kappel.

The second-most congested U.S. urban area was Boston, with 134 hours of delay per driver, followed by New York at 117 hours. Los Angeles, which has often been at the top of the list, was way down in 2022, suffering 95 hours of delay per driver, and was edged out by San Francisco at 97 hours. Miami and Philadelphia were between New York and San Francisco. Continue reading

Sound Planning or Just Luck?

In 2018, Jersey City adopted Vision Zero, the goal of reducing traffic fatalities to zero. In the past year, it had zero fatalities on city-owned streets. Mission accomplished!

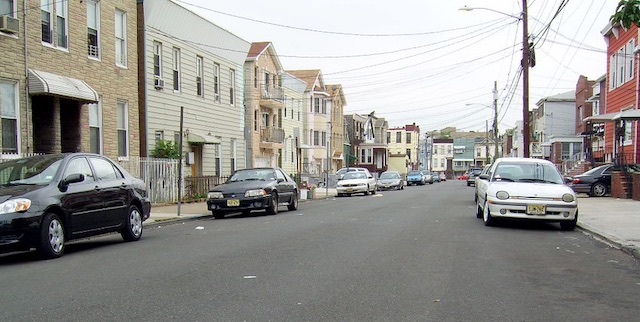
A street in Jersey City. Photo by schokker64.

A Bloomberg article yesterday breathlessly reviewed all the things the city did to reduce fatalities to zero, including roundabouts, road diets, bike lanes, lower speed limits, and the closure of one street to automobiles. Yet there isn’t any real evidence that any of these steps contributed to reduced fatalities. Continue reading

October Driving Greater Than in 2019

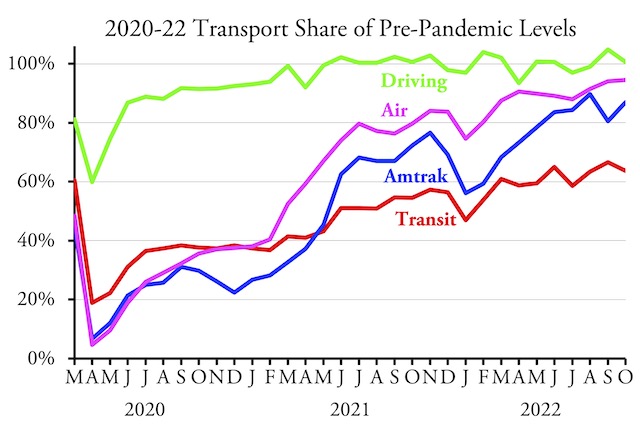
Americans drove 0.6 percent more miles in October 2022 than the same month in 2019, according to data released yesterday by the Federal Highway Administration. This is the second month in a row and the twelfth month in all that driving exceeded pre-pandemic levels since the pandemic began.

See previous posts for information about data from Amtrak and transit and air travel.

Driving exceeded 2019 miles in 26 states, while it fell short in 24 states and DC. The states that saw the greatest increase in driving, relative to October 2019 miles, were South Dakota (22.6%), Arizona (18.8%), Rhode Island (17.6%), Montana (15.4%), Missouri (11.2%), and South Carolina (11.1%). States that are still furthest from full recovery include California (-8.7%), Massachusetts (-8.0%), Delaware (-8.0%), Pennsylvania (-7.4%), and Maryland (-6.1%). Also, DC is -12.6%. Continue reading

Interstates Add Billions to Economy

According to Wikipedia, constructing the Interstate Highway System cost $535 billion in 2020 dollars. Now, three economists from the University of Colorado and Florida State University have calculated the amount of benefits the highway add to our economy.

Interstate highways carry a quarter of all vehicle travel and probably more than a quarter of all heavy truck travel. Photo by Rupert Ganzer.

Their answer was $601.6 billion. Per year. In 2012 dollars, meaning $760 billion in today’s dollars using the GDP deflator. And that’s for freight only; the value of passenger travel is probably at least equal to that. Continue reading

June 2022 Driving Up 0.9% from June 2019

Despite record fuel prices, Americans drove almost 1 percent more miles in June 2022 than they did in June 2019, according to data released on Saturday by the Federal Highway Administration. Driving declined on urban interstate freeways, but it increased on other urban roads as well as all types of rural roads.

See the previous post for sources of Amtrak data and the post before that for sources of data for transit and air travel.

The nationwide average price of regular gasoline climbed from $4.58 a gallon on June 1 to a record $5.02 on June 14. Supposed experts claimed that prices would “stay high for a long time,” but instead they have fallen every day since the 14th, reaching $4.80 at the end of June and $3.90 as of yesterday.

On a miles-per-day basis, Americans drove 1.1 more miles in June than in May and 5.1 percent more in June than in April, when gas prices were 60 to 80 cents a gallon less than in June. This suggests that people are less deterred by high fuel prices than auto opponents would hope.

As noted a few days ago, transit ridership made a leap in June, with average daily ridership being 4.5 percent greater than in May. But since Americans travel almost 100 times as many passenger-miles per year by automobile as by urban transit, a large increase in transit ridership translates to a small decline in driving. That increase in transit ridership may have compensated for the decline in urban interstate driving, but lower fuel prices in July and August will probably lead to an increase in urban driving and a compensatory drop in transit travel.

When compared with June 2019, driving grew the most in Indiana (18%), Florida (16.5%), Connecticut (12.9%), Georgia (11.6%), Louisiana and Texas (each 11.7%). It fell the most short of 2019 miles in the District of Columbia (-19.2%), Delaware (-16.1%), Montana (-11.5%), Oregon (-8.7%), and Washington (-8.5%).

The Automobile Won

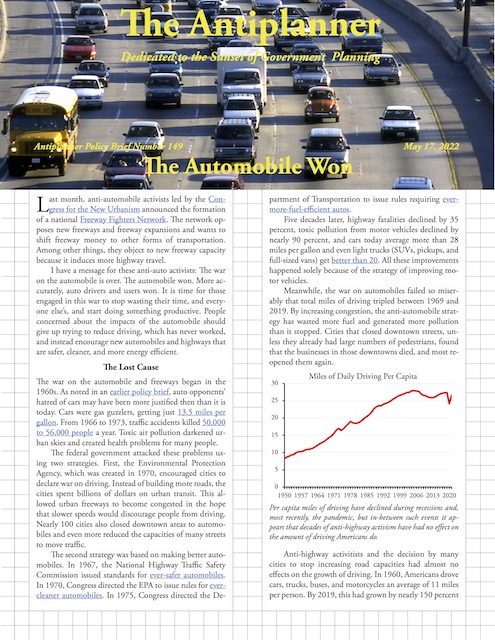
Last month, anti-automobile activists led by the Congress for the New Urbanism announced the formation of a national Freeway Fighters Network. The network opposes new freeways and freeway expansions and wants to shift freeway money to other forms of transportation. Among other things, they object to new freeway capacity because it induces more highway travel.

Click image to download a four-page PDF of this policy brief.

I have a message for these anti-auto activists: The war on the automobile is over. The automobile won. More accurately, auto drivers and users won. It is time for those engaged in this war to stop wasting their time, and everyone else’s, and start doing something productive. People concerned about the impacts of the automobile should give up trying to reduce driving, which has never worked, and instead encourage new automobiles and highways that are safer, cleaner, and more energy efficient.

Continue reading

February Driving 97.1% of Pre-Pandemic Miles

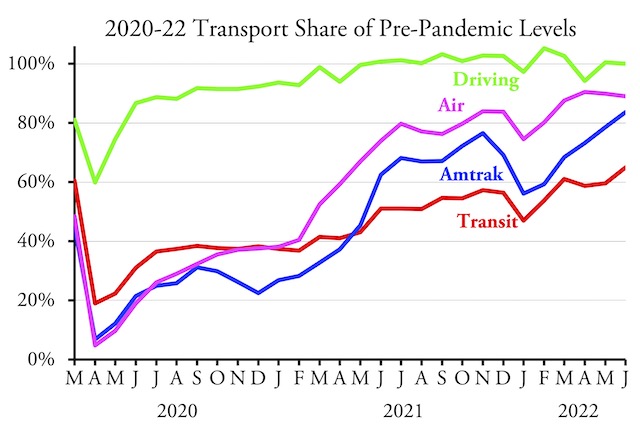
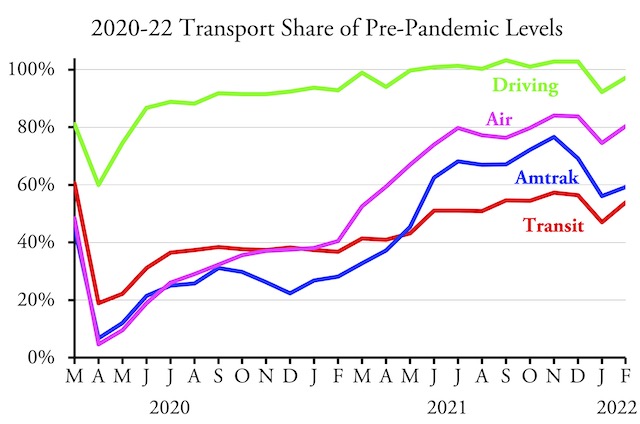
Americans drove almost 236 billion miles in February 2022, according to data released yesterday by the Federal Highway Administration. This was 97.1 percent as many miles as they drove in February 2020, the last month before the pandemic began to affect travel. February 2020 had one more day than February 2022, so if they both had the same number of days, February 2022 probably would have seen more miles driven than in February 2020.

Driving remains well ahead of other modes of travel while transit is furthest behind in its recovery from the pandemic.

The published numbers indicate that February driving in Delaware almost doubled from February 2020 levels, which may be due to an entry error. Otherwise, the largest increases in driving were in Louisiana (18%), Rhode Island (17%), Kentucky (16%), Arkansas, Hawaii, and South Carolina (all 13%), Florida and Indiana (both 12%), and Connecticut (11%). The largest decreases, relative to February 2020, were in Washington state (-21%), Kansas and North Dakota (both -18%), Minnesota (-17%), and Illinois (-12%).