Search Results for: peak transit

Are We Approaching Peak Transit?

“Billions spent, but fewer people are using public transportation,” declares the Los Angeles Times. The headline might have been more accurate if it read, “Billions spent, so therefore fewer are using public transit,” as the billions were spent on the wrong things.

The L.A. Times article focuses on Los Angeles’ Metropolitan Transportation Authority (Metro), though the same story could be written for many other cities. In Los Angeles, ridership peaked in 1985, fell to 1995, then grew again, and now is falling again. Unmentioned in the story, 1985 is just before Los Angeles transit shifted emphasis from providing low-cost bus service to building expensive rail lines, while 1995 is just before an NAACP lawsuit led to a court order to restore bus service lost since 1985 for ten years.

The situation is actually worse than the numbers shown in the article, which are “unlinked trips.” If you take a bus, then transfer to another bus or train, you’ve taken two unlinked trips. Before building rail, more people could get to their destinations in one bus trip; after building rail, many bus lines were rerouted to funnel people to the rail lines. According to California transit expert Tom Rubin, survey data indicate that there were an average of 1.66 unlinked trips per trip in 1985, while today the average is closer to 2.20. That means today’s unlinked trip numbers must be reduced by nearly 25 percent to fairly compare them with 1985 numbers.

Continue reading

Houston Transit: Back to Basics Not Enough

Houston’s Metro transit is going back to basics, focusing on public safety and giving up its expensive light-rail and bus rapid transit plans. This follows the election of a new mayor, John Whitmire, who took office on January 1, 2024 and quickly replaced several members of the Metro board. Though Whitmire is a Democrat, he took office at a time when Houston was facing serious financial problems and so he is taking a fiscally conservative approach to spending.

By many measures, Houston’s Metro is doing better than most U.S. transit agencies. At the end of 2015, it implemented new bus routes, changing from a downtown-centric system to a grid system, as recommended by Jarrett Walker. Partly as a result, ridership grew by 5 percent between 2019 and 2019, a period during which ridership declined in most other urban areas. As of December 2024, ridership has recovered to nearly 88 percent of pre-pandemic levels, compared with a national average of 76 percent. Continue reading

Twin Cities Metro Transit Gets Real

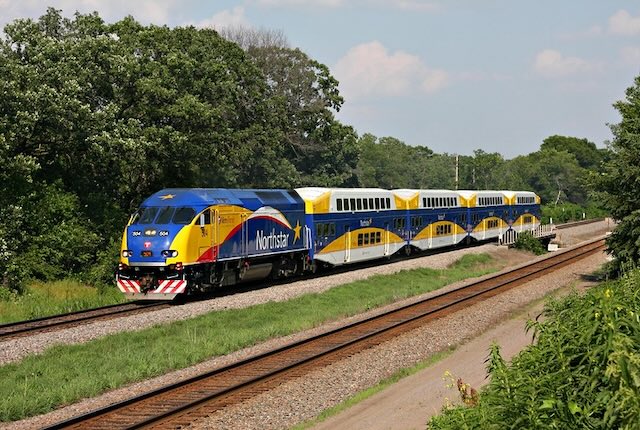
The Antiplanner called Minnesota’s Northstar commuter train a “flop” in 2016. It took the pandemic to do it, but it looks like the state has finally agreed and is now considering plans to shut the line down.

Minnesota’s commuter train was a failure before the pandemic and an even bigger failure after. Photo by Jerry Huddleston.

The line, which cost more than $300 million to start up, was supposed to carry 4,100 riders per weekday, which seems absurdly small for the price. Yet it peaked in 2017 at just 2,800 riders and fell to 2,700 riders in 2019. Since the pandemic, it hasn’t recovered to more than about a sixth of that. The state estimates that the costs of running this service would fall from $12 million a year to $2 million a year if it replaced the trains with buses. In 2023, fares covered less than $325,000 of that $12 million in operating costs. Continue reading

December Transit 77.3% of Pre-Pandemic Ridership

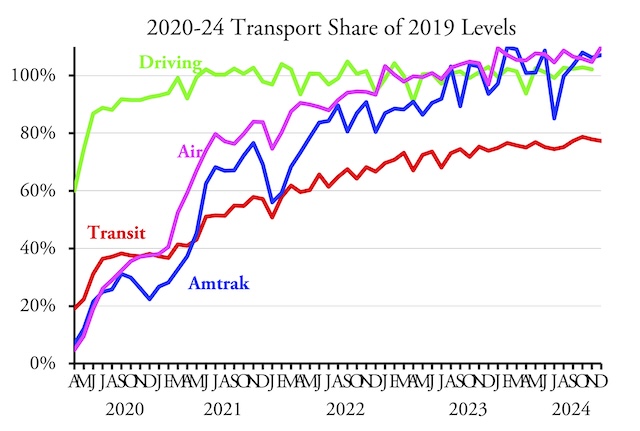
Transit carried 77.3 percent as many riders in December of 2024 as the same month in 2019, according to preliminary data released late last week by the Federal Transit Administration. That’s down from 78.4 percent in November. Ridership for calendar year 2024 ended up being 76.5 percent of 2019.

Highway data will be added as soon as it is available. For a discussion of Amtrak and airline data, see this post from last week.

Because monthly numbers are preliminary and FTA updates prior months with each new release, I went through and corrected transit numbers for previous months in the above chart. I counted only 96.55 percent of February 2024 riders as that month had one more day than February 2019. As corrected, transit reached a peak, relative to pre-pandemic levels, of 78.7 percent in October, and dropped in both November and December. Continue reading

32 Years of Transit Data

When the Federal Transit Administration released the 2022 National Transit Database, it also released updated time series data tables. These tables have operating data (including costs and ridership) from 1991 through 2022, capital costs from 1992 through 2022, and fare revenues from 2002 through 2022.

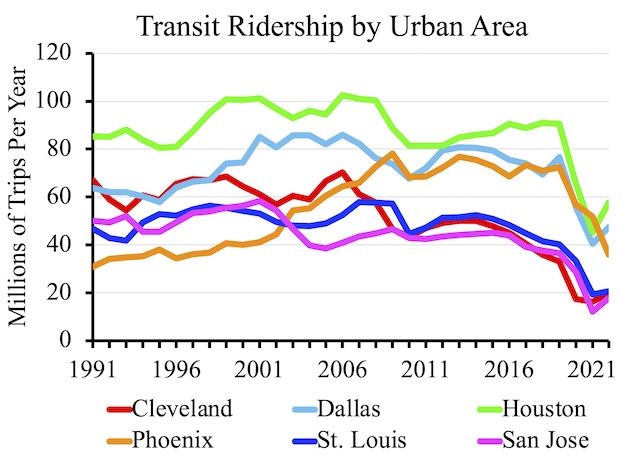
This chart shows ridership for six urban areas that I consider to be basket cases, with ridership steadily declining despite — or more likely because of — the construction of light-rail or some other transit infrastructure. Of course, ridership declined everywhere due the pandemic, but most of these are among the slowest to recover to their already low 2019 levels.

The release includes six data tables, but I find just two of them useful as they are the only two that break down data by mode. Table TS3.1 has capital costs by transit agency and mode. Table TS2.1 has all other information — operating costs, fares, service in miles and hours, ridership, passenger-miles, and miles of rail lines — by agency and mode. Continue reading

A Polycentric Transit Plan for St. Louis

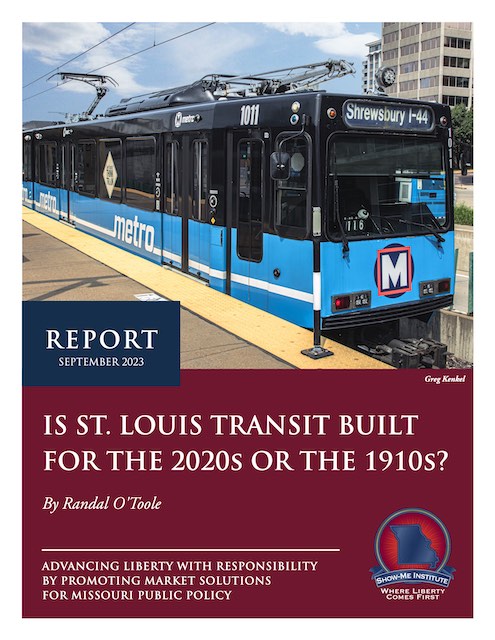
St. Louis has more miles of light rail than any other Midwestern urban area, yet fewer people rode St. Louis transit in 2019 than in 1991, before the region opened its first mile of light rail. According to a new report from the Show-Me Institute, this is because Metro, the region’s transit agency, has planned its transit system for the 1910s, not the 2020s.


Click image to download a 4.3-MB PDF of this report.

That means that Metro has built a system that assumes that most people work downtown, live in dense residential neighborhoods close to light-rail stops, and don’t have access to automobiles. None of those conditions have been true for at least 50 years, and Metro’s system is especially unsuited to the post-pandemic world. Continue reading

Nashville Transit Junkies Demand More Money

Spending billions of dollars on on transit infrastructure, as proposed by a group called the Transit Alliance for Middle Tennessee, would be a complete waste. The group was formed to support the city’s 26-mile, $5-billion light-rail proposal that was rejected by voters five years ago. Now that the pandemic has proven that Nashville doesn’t need any transit infrastructure, the group is reemerging as an “advocate for action.”

The group wants “multimodal transportation,” which to them means bus-rapid transit on dedicated lanes, light rail, commuter rail, and maybe even heavy rail and monorail. For some reason, the group doesn’t mention cars, trucks, bicycles, pedestrians, scooters, and local buses, all of which make Nashville’s existing transportation infrastructure pretty multimodal. Continue reading

2022 Transit 62.0% of 2019

Urban transit carried just over half a billion trips in the United States in December, and just under 6 billion in 2022 as a whole, according to December 2022 transit data released Monday by the Federal Transit Administration. December’s ridership was 66.0 percent of December 2019 while the calendar year’s was 62.0 percent.

Transit trips are from the National Transit Database; Amtrak passenger-miles are from Monthly Performance Reports; airline passenger data are from the Transportation Security Administration; and highway vehicle-mile data are from the Traffic Volume Trends. December highway data will be available in a week or so.

Meanwhile, after reaching above 90 percent of 2019 numbers in November for the first time since the pandemic, Amtrak numbers fell to 80 percent in December, its lowest, measured as a percentage of 2019, since May. Airline passenger numbers fell a little bit as well, but only from 94.3 to 93.3 percent of 2019. December highway numbers should be available soon. Continue reading

Will the Infrastructure Bill Improve Transit?

The Senate Committee on Banking, Housing, and Urban Affairs held a hearing yesterday on how last year’s infrastructure law will “advance” transit. Three of the witnesses represented transit agencies or transit unions and all talked about how the law will fund new transit projects, but none talked about whether those projects would lead to more riders.

In contrast, testimony from the Antiplanner argued that taxpayers have spent well over $1.5 trillion in the last 50 years only to see transit ridership per urban resident decline. The new spending will enrich engineering and construction firms but not lead to more riders. My testimony begins at 55:30; here is my written testimony and here is my speaking text.

Except for ranking committee member Pat Toomey, the only senators in attendance were Democrats. They were less interested in my dire predictions than in hearing from the agency representatives about how excited they were to have more money to spend. Continue reading

Transit 2020: The First Year of the Pandemic

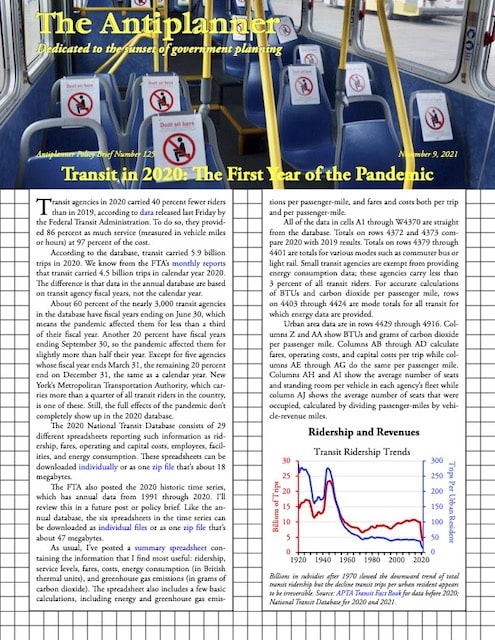
Transit agencies in 2020 carried 40 percent fewer riders than in 2019, according to data released last Friday by the Federal Transit Administration. To do so, they provided 86 percent as much service (measured in vehicle miles or hours) at 97 percent of the cost.

Click image to download a four-page PDF of this policy brief.

According to the database, transit carried 5.9 billion trips in 2020. We know from the FTA’s monthly reports that transit carried 4.5 billion trips in calendar year 2020. The difference is that data in the annual database are based on transit agency fiscal years, not the calendar year. Continue reading