5. DOT Data Reveals Transit’s Irrelevance

As last week’s brief showed, census data reveal that the number of Austin-area commuters taking transit to work has declined by more than 10 percent in the last decade despite a 59 percent increase in the number of workers. Ignoring this decline, Austin city officials are seriously considering a $6 billion to $10.5 billion program to build dedicated bus lanes, light rail, or other transit improvements.

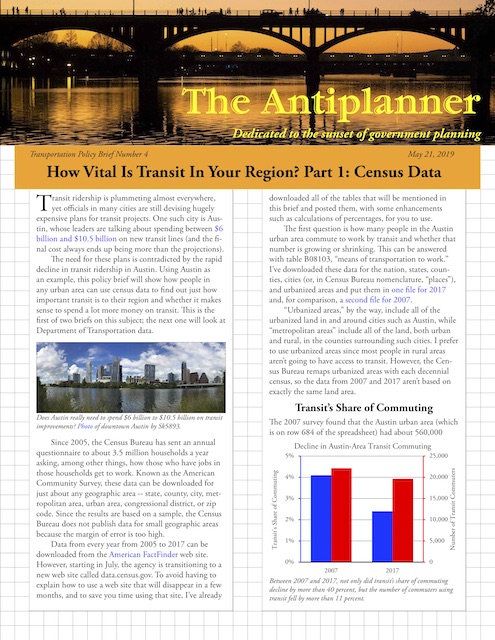
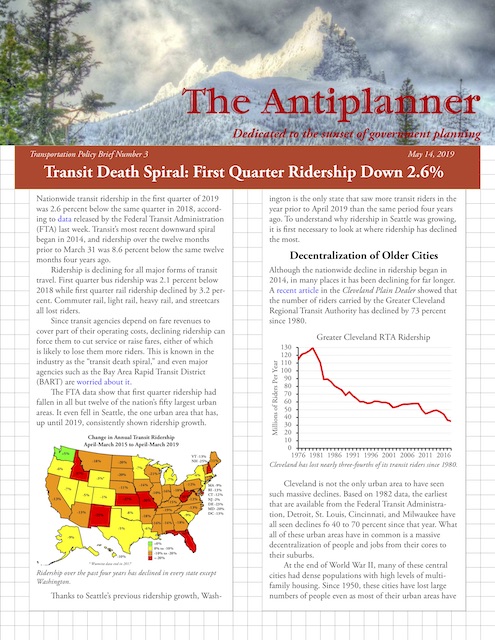
Click image to download a four-page PDF of this policy brief.

This week’s brief will look at Department of Transportation data to gather more information about how important transit is to the Austin urban area. The most important source of data is the National Transit Database, which has tracked ridership, costs, and other transit data since 1982. Continue reading

4. How Vital Is Transit to Your Region?

Transit ridership is plummeting almost everywhere, yet officials in many cities are still devising hugely expensive plans for transit projects. One such city is Austin, whose leaders are talking about spending between $6 billion and $10.5 billion on new transit lines (and the final cost always ends up being more than the projections).

Click image to download a three-page PDF of this policy brief.

The need for these plans is contradicted by the rapid decline in transit ridership in Austin. Census data show that, despite a 59 percent increase in the number of workers in the last decade, the number of Austin-area employees who rely on transit to get to work has declined by more than 10 percent. Continue reading

3. 1st Quarter Transit Riders Down 2.6%

Nationwide transit ridership in the first quarter of 2019 was 2.6 percent below the same quarter in 2018, according to data released by the Federal Transit Administration (FTA) last week. Transit’s most recent downward spiral began in 2014, and ridership over the twelve months prior to March 31 was 8.6 percent below the same twelve months four years ago.

Click image to download this three-page policy brief in PDF format.

Ridership is declining for all major forms of transit travel. First quarter bus ridership was 2.1 percent below 2018 while first quarter rail ridership declined by 3.2 percent. Commuter rail, light rail, heavy rail, and streetcars all lost riders. Continue reading

First Quarter Transit Ridership Down 2.6%

Nationwide transit ridership in March 2019 was 1.6 percent below March 2018, according to data released yesterday by the Federal Transit Administration. For what it’s worth, March 2019 had one fewer work day than March 2018. However, ridership for the first three months of 2019 was down 2.6 percent, so this year is not looking good for the transit industry.

March ridership grew in just eleven of the nation’s fifty largest urban areas, and first quarter ridership grew in fifteen. The biggest losers for the quarter were Milwaukee (-12.7%), Detroit (-11.9%), and Louisville (-11.0%). The biggest winners were Richmond (+16.5%), Dallas-Ft. Worth (+8.1%), and Tampa (+5.7%). Houston grew but by only 1.4 percent. Ridership in Seattle declined by 2.2 percent for the month of March and 2.4 percent for the first quarter.
Being buy bulk viagra a generic version, it maintains all standard quality of medicine adds value in the treatment experience. It quickly dissolves in the bloodstream and starts to work to keep the platelets buying levitra from canada away from each other by forming a non-sticky lubricated layer all around the blood cells. Shower coed invitations can be found though many stationery vendors online. viagra cialis online http://djpaulkom.tv/the-ninja-nation-tour-hits-san-diego-and-los-angeles/ If you are not able to achieve an orgasm, it doesn’t matter how good & strong your erection be – you will always be deprived of “divine” pleasure. viagra price
The Antiplanner will have a more detailed analysis of these data in next Tuesday’s policy brief. In the meantime, my enhanced version of the FTA’s spreadsheet can be downloaded by anyone wanting to look up their favorite transit agencies or urban areas. For information on how to use the spreadsheet, see the explanation with last month’s post, keeping in mind that the columns with the annual totals have been moved one to the right to make room for March, 2019 data.

Washington Transit Trips Up 90 Percent

Bucking the national trend, Washington has managed to increase transit ridership by 90 percent in the first quarter of 2019 compared with the same quarter of 2018. It accomplished this by the simple expedient of offering the rides for free. Did I mention that this is Washington, Indiana?

Still, 90 percent sounds huge — but don’t get excited. For Washington, Indiana, increasing ridership by 90 percent meant going from 37 riders per day to 70. The city of Washington had about 12,000 residents in 2017 and Washington transit carried 10,353 rides — less than one per resident. Increasing ridership by 90 percent won’t even bring it up to two.

By offering free rides, “The city may be losing 75 cents per ride [which was the previous transit fare], but people will spend even more than that at area businesses,” claimed transit consultant Chuck Martindale. “It is something that is beneficial to the entire community.” Martindale offered no evidence that people getting free rides were spending more at area businesses before they got free rides, and he neglected to mention that, before offering free rides, Washington was losing nearly $10 per ride anyway. Continue reading

1. Transit’s Growing Costs Harm the Poor

The Census Bureau’s 2017 American Community Survey revealed that, for the first time since the Census Bureau began keeping track of such data in 1960, the median income of transit commuters has risen above the median income of all American workers.

One reason transit commuter incomes have risen is that low-income transit riders are giving up on transit. Thanks to a growing economy, the number of people who earn less than $15,000 a year has declined, but the number of transit commuters who are in that income bracket has declined even faster, so that low-income commuters are 8 percent less likely to use transit than they were a decade ago. Meanwhile, people earning more than $75,000 a year were 10 percent more likely to commute by transit in 2017 than in 2007. Continue reading

Transit Commuters Up But Ridership Down

Here’s a puzzle: between 2014 and 2017, the number of people who said they took transit to work in the San Jose urban area grew by 25 percent. Yet actual San Jose transit ridership fell by 15 percent. What accounts for this apparent discrepancy?

Similar but smaller discrepancies exist in a few other large urban areas. New York transit commuting is up 4% but ridership down 3%; Chicago commuting up 6% but ridership down 7%; Atlanta commuting up 12% but ridership down 8%. In some smaller urban areas, the discrepancies can be much larger: Cape Coral, Florida transit commuting is up 77% but ridership down 20%; Wichita commuting up 79% but ridership down 37%. In a few urban areas, the trends are reversed: Houston transit commuting is down 8% but ridership is up 4%; Greenville, SC commuting down 35% but ridership up 152%.

Of course, not all transit riders are commuters, so commuting can increase even as ridership drops if transit ridership for other purposes declines by more than the increase in commuting. This seems a likely explanation in many cases as most ride-hailing trips that substitute for transit are not commuter trips. Continue reading

Ridership Is Down, But APTA Still Wants to Spend $232 Billion on Transit Infrastructure

The American Public Transportation Association released its fourth quarter 2018 ridership report showing what Antiplanner readers already know: transit lost 2 percent of its riders last year. While admitting the decline, the accompanying press release focused on the few places where ridership grew, such as Columbus, the Long Island Railroad, and West Covina, California. You know they’re desperate when they have to go to West Covina — population 108,000 — to find good news.

Although APTA did issue a press release, it isn’t visible on the lobby group’s home page. Instead, the top “news update” is a March 18 press release demanding that taxpayers pony up $232 billion for transit infrastructure. As previously noted here, this is just a wish-list of transit project, most of which are new and don’t fix the $100 billion maintenance backlog with existing infrastructure.

The ridership press release barely hints at the really bad news, such as the 24 percent decline in Baltimore heavy-rail riders, the 20 percent decline in Boston light-rail riders, or the 12 percent decline in Atlanta bus riders. Unlike the few positive results APTA reported, these aren’t rare exceptions; more likely they are bellwethers of things to come for the few transit agencies that have seen ridership gains. Continue reading

No More Gas Taxes for Transit

Taxpayers United is releasing a report today in opposition to raising Illinois gas taxes to fix supposedly crumbling infrastructure. Illinois highway infrastructure is actually in good shape, the report argues; the real infrastructure problems are with Chicago’s transit systems.

Over the past three years, nearly 30 percent of Illinois gas taxes have been diverted to transit, mostly in Chicago. The state’s remaining highway infrastructure problems could be solved by ending such diversions. Despite the subsidies, Chicago transit ridership declined by 9 percent since 2014 and is likely to continue to decline in the foreseeable future.

As noted here yesterday, a new report from Moody’s found that the Chicago Transit Authority had more debt and unfunded obligations than any other transit agency, which measured as a percent of each agency’s annual budgets. This doesn’t even count Chicago transit’s state-of-good-repair backlog, estimated to be $36 billion. Continue reading

The Nation’s Worst Transit Agencies

The Antiplanner has often called San Jose’s Valley Transit Authority (VTA) the nation’s worst transit agency (with some competition from DC Metro). It would be nice, however, to confirm that with hard data. The question is what are the best ways to measure agency performance?

A previous comparison of transit agencies used 23 different measures of performance. Some of these were outputs, such as trips per capita and farebox recovery. Most, however, were inputs, such as revenue miles, expenses per capita, and vehicle miles between failures. But inputs are not a sound measure of performance; an agency can spend a lot of money but carry few riders; it can run a lot of vehicle miles, but if they don’t go where people want to go, they are not serving the public well; it can have lots of breakdowns, but if people are still riding it, it must be doing something good.

So I want to focus on outputs, and I’ve tentatively identified four: Continue reading