Transit Carried 74.9% of 2019 Riders in November

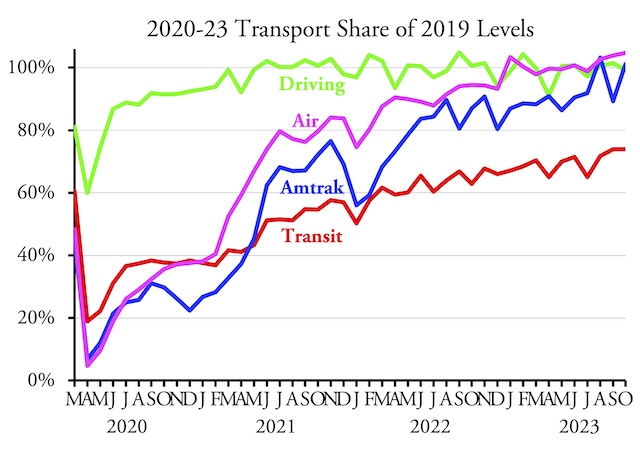
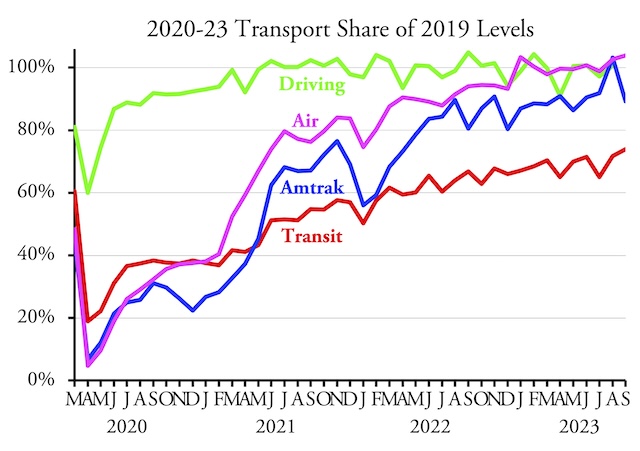
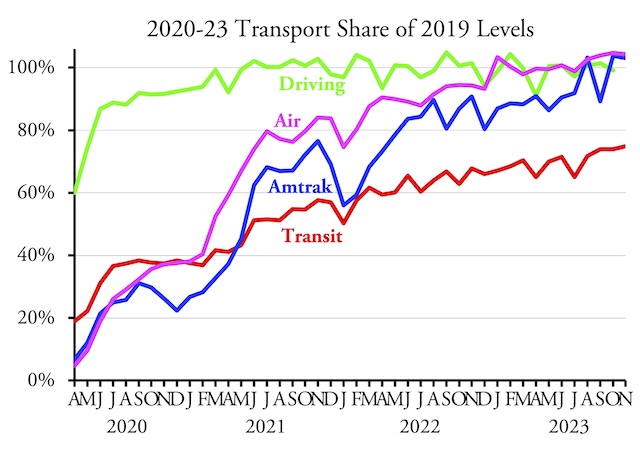
America’s transit systems carried nearly 75 percent as many riders in November 2023 as the same month in 2019, according to data released on Friday by the Federal Transit Administration. This is the most riders transit has attracted, as a share of pre-pandemic levels, since the pandemic began in March 2020.

Transit’s failure to carry even three-fourths of its pre-pandemic passengers stands in contrast to Amtrak, which carried 3.1 percent more passenger-miles in November 2023 than 2019, and the airlines, which carried 4.3 percent more riders in November than in 2019. Release of airline passenger-mile data tends to be more than a month later than passenger numbers, but in September domestic air routes carried 6.0 percent more passenger-miles than the same month in 2019. November highway data are not yet available but an update will be posted here when they are. Continue reading

October Driving 99.2% of Pre-Pandemic Levels

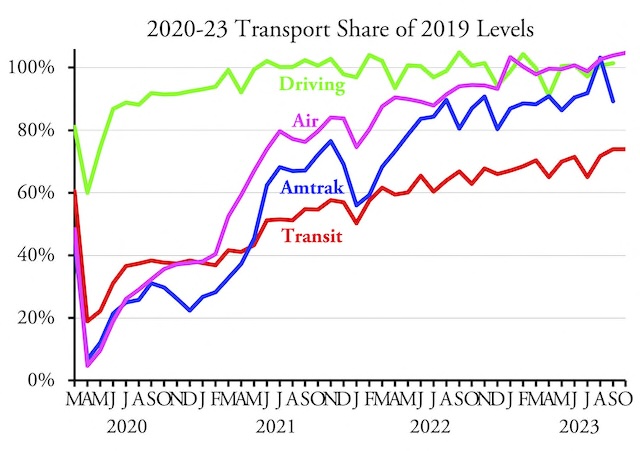
Americans drove more than 99 percent as many miles in October of 2023 as they did in the same month in 2019, according to data released yesterday by the Federal Highway Administration. Miles of driving have been hovering around 100 percent of pre-pandemic levels since March of 2021.

Transit and airline performances in October were reviewed on December 7 and Amtrak’s on December 11.

Although driving has recovered, the places and times people drive have changed. Rural driving is 2 percent ahead of 2019 numbers while urban driving is 2 percent behind. Within both rural and urban areas, driving is greater on interstate freeways than on other arterials and greater on other arterials than on other roads and streets. Continue reading

October Transit Ridership Levels Off

Transit carried 73.90 percent as many riders in October 2023 as in the same month in 2019, according to data released by the Federal Transit Administration yesterday. This is just a couple of hairs less than the 73.92 percent carried in September. Rail ridership was 71.0 percent of 2019 while bus ridership was 76.6 percent. Actual October ridership was more than September’s, which is the case for most years.

As with last month, New York, Los Angeles, Miami, and Houston transit systems are much better than average, carrying 78 to 85 percent of 2019 levels. Washington seems to have caught up with the average, carrying 73.7 percent. Atlanta, Boston, Phoenix, and San Francisco are all doing worse than average, carrying less than 70 percent and, in Phoenix’s case, less than 56 percent of 2019 numbers. Continue reading

European Passenger Train Travel Declining

The media treat Americans to a constant drumbeat of how much better European passenger trains are and why we need to spend hundreds of billions or trillions improving our train system. The latest is a report that overnight trains are proving they can replace air travel by “play[ing] an important niche role on long-distance routes of between 500 and 1,000 miles.”

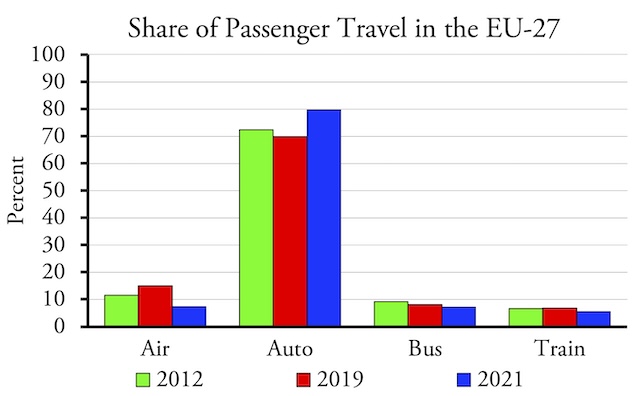
A look at the actual data reveal that, despite huge government subsidies to European passenger trains, rail was barely holding its own before the pandemic and has drastically declined since the pandemic. Between 2012 and 2019, the share of passenger travel carried by airlines grew from 11.6 to 15.0 percent while the share carried by trains grew only from 6.7 to 6.8 percent. Most of the growth of rail travel was at the expense of bus travel, which declined from 9.1 to 8.1 percent. Auto travel from 72.3 to 69.8 mostly because of low-cost airlines. Continue reading

September VMT Continues to Exceed 2019

Americans drove 1.4 percent more miles in September 2023 than in the same month in 2019, according to data released by the Federal Highway Administration yesterday. Vehicle miles of travel (VMT) have exceeded 2019 numbers in seven out of the last twelve months.

Most of the increase in driving was in rural areas. Although September’s rural driving was 4.6 percent greater in 2023 than 2019, urban driving was only 0.1 percent greater. The increase in urban driving was on collector and local streets; freeway and arterial driving were still a little short of 100 percent of 2019 miles. Continue reading

Transit Slowly Recovers

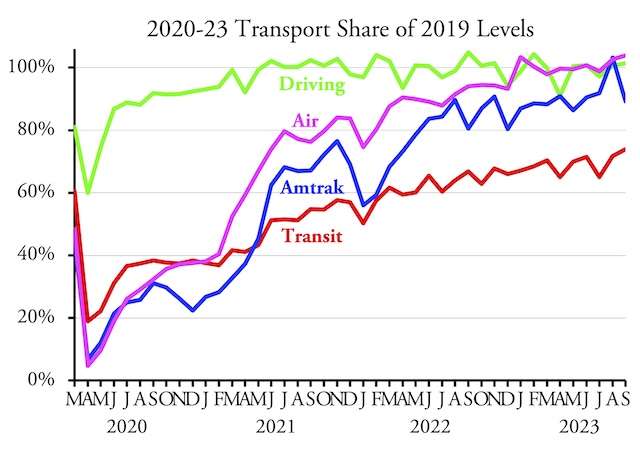
U.S. transit systems carried 73.9 percent as many riders in September 2023 as the same month in 2019, according to data released earlier this week by the Federal Transit Administration. This is transit’s highest level, as a percent of 2019 numbers, since the pandemic began. This is particularly remarkable as September 2023 had one less business day than September 2019.

Highway data for September 2023 are not yet available. This chart and post will be updated when they are released.

Transit was aided by the fact that September ridership in the New York urban area, where 46 percent of all transit rides take place, reached 78.6 percent of pre-pandemic numbers. Transit is also doing better than average in Los Angeles (79.3%), Miami (83.4%), Dallas (78.4%), and Houston (87.2%). Washington reached 73.8 percent, just slightly below the national average. Ridership continues to be below average in Chicago (63.1%), Philadelphia (59.4%), Atlanta (60.6%), Boston (64.0%), Phoenix (55.8%), and San Francisco-Oakland (64.4%), to name a few. Although transit ridership is slowly recovering, it is still well behind driving, which first reached 100 percent of pre-pandemic miles in June, 2021. Continue reading

32 Years of Transit Data

When the Federal Transit Administration released the 2022 National Transit Database, it also released updated time series data tables. These tables have operating data (including costs and ridership) from 1991 through 2022, capital costs from 1992 through 2022, and fare revenues from 2002 through 2022.

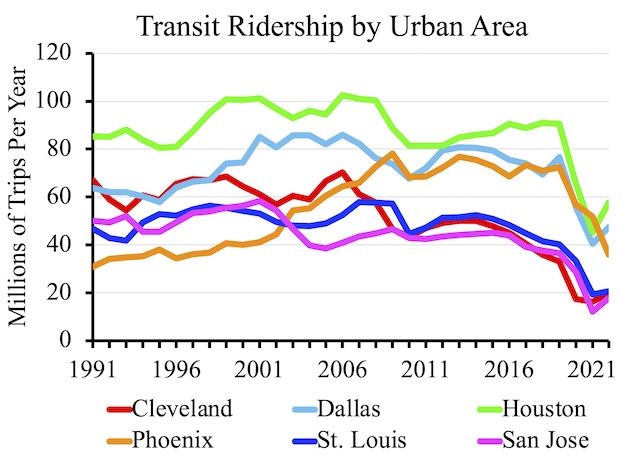
This chart shows ridership for six urban areas that I consider to be basket cases, with ridership steadily declining despite — or more likely because of — the construction of light-rail or some other transit infrastructure. Of course, ridership declined everywhere due the pandemic, but most of these are among the slowest to recover to their already low 2019 levels.

The release includes six data tables, but I find just two of them useful as they are the only two that break down data by mode. Table TS3.1 has capital costs by transit agency and mode. Table TS2.1 has all other information — operating costs, fares, service in miles and hours, ridership, passenger-miles, and miles of rail lines — by agency and mode. Continue reading

2022 National Transit Database

Last year, Americans took about 6 billion trips on transit covering about 30 billion passenger-miles, according to the 2022 National Transit Database, which the Federal Transit Administration released late last week. This was about 61 percent as many trips and 56 percent as many passenger-miles as in 2019. Annual numbers in the National Transit Database are based on transit agency fiscal years and will not agree with calendar year numbers.

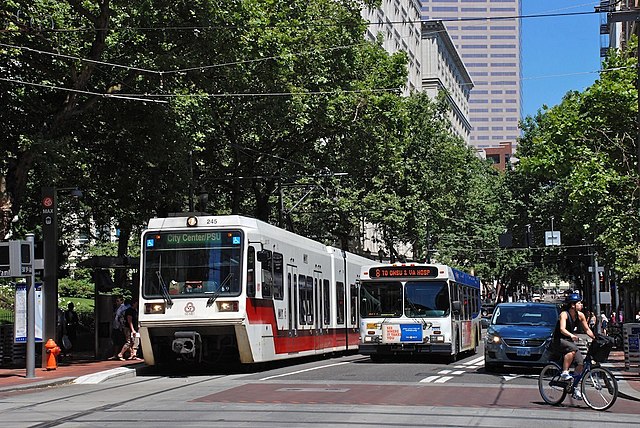
Portland’s transit mall has both buses and light rail; it’s worth noting that adding light-rail to the mall reduced the number of people that the mall could move per hour. Photo by Steve Morgan.

The 2022 database comes in the form of 29 different spreadsheets. To simplify it, I have collapsed these into a single spreadsheet that contains that data I find most useful for every transit agency and mode of transit. These data include trips, passenger-miles, service (in VRM or vehicle-revenue-miles and VRH or vehicle-revenue-hours), average weekday ridership, fares (including fares paid by riders and fares paid by organizations), operating costs, capital costs (including costs for existing service and costs for expanded service, plus unspecified costs for smaller agencies), number of vehicles, number of seats, amount of standing room, and revenue rail miles. Continue reading

All Recovered but Transit

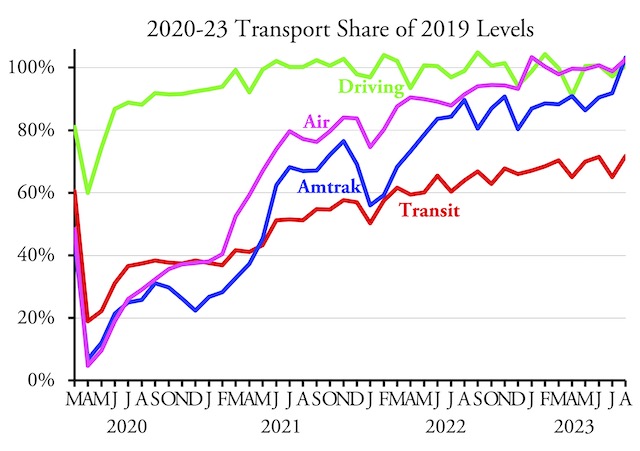
Highways, airlines, and Amtrak all carried more travel in August 2023 than the same month before the pandemic, according to data recently released by the Department of Transportation. Urban transit, however, is languishing at less than 72 percent, and it would be even lower except that August had one more business day in 2023 than in 2019. Agencies such as the Regional Cleveland Transit Authority and San Jose’s Valley Metro that were behind on their data reporting have caught up, so can’t be used as an excuse for the industry’s overall poor performance.

Highway vehicle miles and transit ridership data were released yesterday. Amtrak issued its monthly performance report, including passenger-miles earlier in the week. Airline data are based on Transportation Security Administration counts, which are updated daily. Air passenger-miles are reported by the Bureau of Transportation Statistics but they are further behind, having issued data only up through June. Continue reading

Pandemic Increases Homeownership, Single-Family

The share of homes owned by their occupants grew from 64.1 percent in 2019 to 65.2 percent in 2022, according to data from the American Community Survey. The share of homes that were single-family increased slightly from 68.6 percent to 68.6 percent.

The share of people living in owner-occupied homes grew from 66.4 percent in 2019 to 68.4 percent in 2022, while the share of people living in single-family homes grew from 73.6 percent in 2019 to 74.2 percent in 2022. Continue reading