September VMT Continues to Exceed 2019

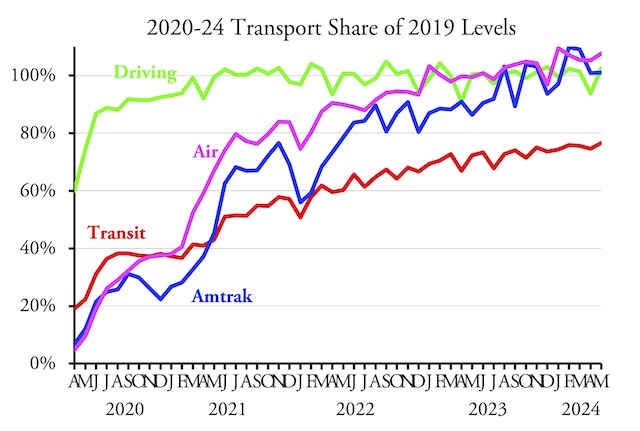
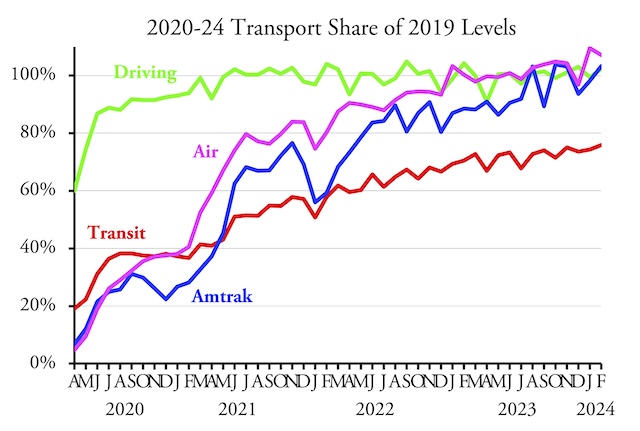
Americans drove 1.4 percent more miles in September 2023 than in the same month in 2019, according to data released by the Federal Highway Administration yesterday. Vehicle miles of travel (VMT) have exceeded 2019 numbers in seven out of the last twelve months.

Most of the increase in driving was in rural areas. Although September’s rural driving was 4.6 percent greater in 2023 than 2019, urban driving was only 0.1 percent greater. The increase in urban driving was on collector and local streets; freeway and arterial driving were still a little short of 100 percent of 2019 miles. Continue reading

Keep Highway User Fees

The Tax Foundation notes that Republican presidential candidate Nikki Haley has proposed to save consumers money by eliminating federal fuel taxes. That’s an extremely short-sighted idea that would actually cost consumers in the long run. As the foundation’s writers, Alex Muresianu and William McBride, observe, Haley could have proposed that the gas tax, an imperfect user fee, be replaced with a better user fee such as a mileage-based fee. But instead she proposed to simply eliminate the tax.

A sunset for gas taxes?

The most recent report indicates that, as of yesterday, the price of regular gasoline averaged about $3.64 nationwide. Eliminating the federal gas tax would reduce that to by 18¢ to $3.46 a gallon — less than 5 percent. Encouraging more domestic oil production could cut fuel prices by more than a dollar a gallon, down to what prices were in around 2015-2020. If Haley wants driving to be more affordable (which I think would be a good thing), that’s what she should promote. Continue reading

Do Higher Speeds = Higher Incomes?

A new study published by the National Bureau of Economic Research (ungated copy) finds that, whaddyknow, faster urban speeds are associated with richer countries. The study looked at urban travel speeds in 1,200 cities around the world to “find that improved urban mobility is an important and previously undocumented feature of economic development.”

Important yes, but hardly previously undocumented, as researchers such as Rémy Prud’Homme in France and Sam Staley and Adrian Moore in the United States have looked at the relationship between travel speeds and economic productivity. That has also been a consistent theme of the Antiplanner, especially when comparing the ability of fast cars vs. slow transit to help people out of poverty. Continue reading

July 2023 Transit Ridership 65% of July 2019

After reaching 70 percent of pre-pandemic numbers in June, transit ridership in July fell back to 65 percent of July 2019, according to data released last week by the Federal Transit Administration. Since July 2019 had 22 working days while July 2023 only had 20, this decline is not surprising.

Meanwhile, Americans drove 97.2 percent as many miles in July 2023 as in the same month of 2019, according to Federal Highway Administration data released last week as well. Amtrak’s monthly performance report indicates that the railroad carried 91.2 percent as many passenger-miles in July 2023 as July 2019, while the Transportation Security Administration says that 98.8 percent as many travelers passed through security in July as in 2019. Continue reading

June Driving 0.75% Greater Than in 2019

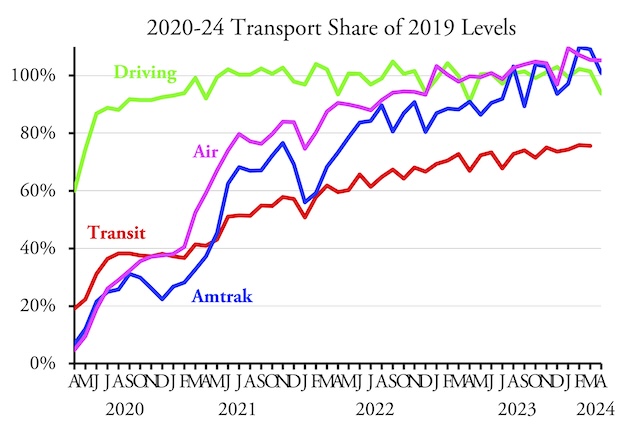
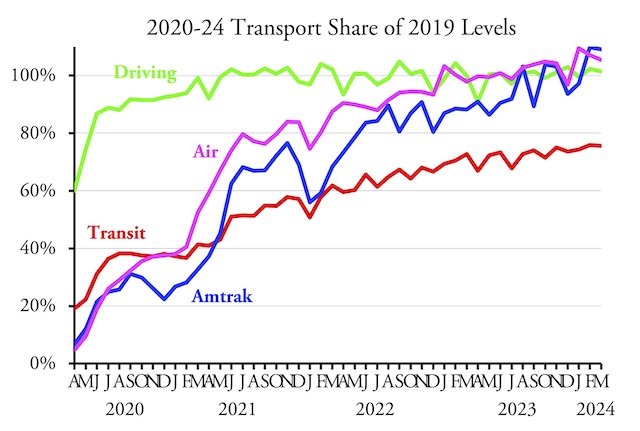
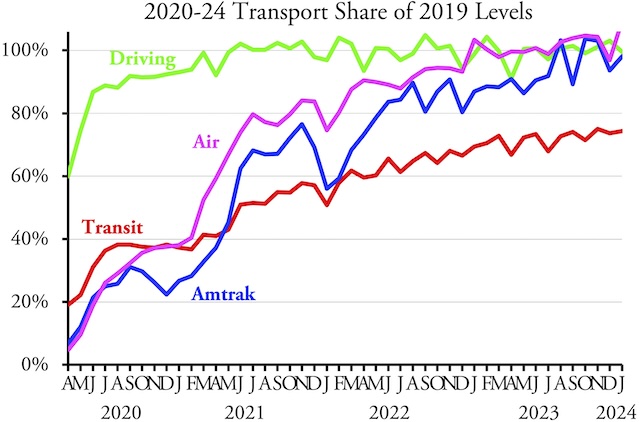
Americans drove slightly more miles in June 2023 than they did in June 2019, according to data released yesterday by the Federal Highway Administration. Highway driving first reached 100 percent of pre-pandemic levels in June of 2021 and has been hovering around 100 percent ever since. In comparison, flying didn’t reach 100 percent until January of this year, while Amtrak has been hovering around 90 percent since August 2022 and transit has never exceeded 72 percent.

For a detailed discussion of Amtrak results, see last Tuesday’s post. For a detailed discussion of transit and airline results, see last Saturday’s post.

Urban driving was only 99.0 percent of pre-pandemic levels, but rural driving more than made up for it at 105.3 percent. Total miles of driving exceeded 2019 numbers in 27 states, with the biggest gains in Idaho (117%), Missouri (114%), Alaska (114%), Colorado (113%), Wyoming (112%), and Michigan (111%). Driving is still only 76 percent of pre-COVID levels in the District of Columbia and is also woefully short in Illinois (84%), Massachusetts (91%), Maryland (92%), California (93%), Hawaii (94%), Washington (94%), and Georgia (94%). Driving in all other states was at least 95 percent of 2019 miles. Continue reading

Transit’s Minuscule Share of 2021 Travel

Public transit carried 6.4 percent of 2021 motorized passenger travel in the New York urban area. It also carried 1.6 percent in Honolulu, 1.5 percent in San Francisco-Oakland, 1.4 percent in Seattle, 1.2 percent in Chicago, and 1.1 percent in Salt Lake City. In every other urban area it carried less than 1 percent; nationwide, transit carried just 0.7 percent of all motorized urban travel.

Chicago transit carried 1.2 percent, autos the other 98.8 percent of motorized passenger travel.

I calculated these numbers by comparing passenger-miles in the 2021 National Transit Database, which was released last fall, with daily vehicle miles of travel (DVMT) by urban area in table HM-72 of Highway Statistics, which was recently released by the Federal Highway Administration. To make the numbers comparable, I multiplied DVMT by 365 to get annual data and by 1.7 to account for vehicle occupancies, 1.7 being the result when dividing passenger-miles by vehicle-miles in Highway Statistics table VM-1. These numbers don’t include walking, bikes and e-bikes, or scooters, but they do include motorcycles. Continue reading

Cities More Accessible in U.S. Than Europe

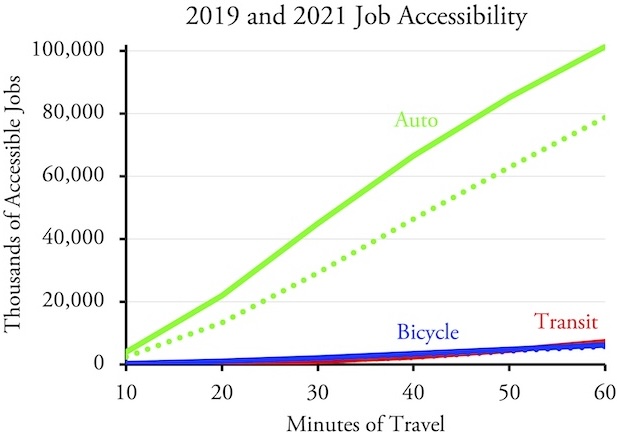
“Should the U.S. repair crumbling roads and highways to enhance car-based mobility or replace them with new public transit infrastructure that re-orients U.S. commuting systems away from their current car dependence?” asks a paper recently published by the National Bureau of Economic Research. To answer the question, the paper compared accessibility via transit and driving in about 50 U.S. and 50 European cities. If transit made European cities more accessible, the researchers reasoned, then it would make sense for the U.S. to emphasize transit as well.

Should the United States attempt to build as much transit infrastructure as is found in Europe even if doing so reduces people’s access to jobs and other economic opportunities?

Instead, the researchers — two economists from Yale and one from UC San Diego — found that U.S. urbanites had far more access to their cities than Europeans did in theirs. Moreover, Europeans using cars had far more access to their cities than those who relied on transit. This shouldn’t be a surprise to those familiar with the research published by the University of Minnesota’s Accessibility Observatory, but it seems to have surprised the people doing this research. Continue reading

Transit Continues to Lag Behind Driving

Americans drove more miles in May 2023 than the same month of 2019, according to data released by the Federal Highway Administration earlier this week. Transit ridership, however, was still less than 70 percent of 2019 levels, according to the Federal Transit Administration’s latest data.

At 69.9 percent of pre-pandemic levels, transit ridership was very close to 70 percent, a threshold it has breached only once since March 2020. To be fair, Cleveland’s regional transit agency is late in reporting ridership numbers. Though the agency carries only 0.3 percent of the nation’s transit riders, when its numbers are added, the national total for May will slightly exceed 70 percent of 2019. Continue reading

Highway Safety Results Are Mixed

Highway fatalities declined slightly in 2022 despite an increase in the miles of driving, and they declined again in the first three months of 2023. However, the changes are small and it’s too soon to say whether this is a trend or just a short-term quirk in the data.

Photo by Ragesoss.

Short-term changes in fatalities and fatality rates are something of a mystery. In the long run, safer roads and safer cars have pushed down fatalities from a peak of 55,600 in 1972, for a rate of 44.1 deaths per billion vehicle-miles of travel, to a low of under 32,500 in 2011, for a rate of only 11.0 deaths per billion vehicle-miles. The rate fell even lower to 10.8 per billion in 2014. Continue reading

Interstate 95 and Induced Demand

Kudos to the Pennsylvania Department of Transportation for constructing a temporary replacement for a collapsed overpass in just 12 days, something that many predicted would take months. The replacement is just six lanes wide rather than the eight on the original overpass, but that leaves room for the department to construct a permanent replacement.

Some people are drawing the wrong lessons from the response to the highway collapse, however. According to Joe Cortright, the fact that there was no “carmageddon” during the 12 days the highway was closed proves that we don’t need highways at all. According to what Cortright calls the “science of ‘induced demand,'” building new roads simply leads to more driving and, conversely, closing roads leads to “traffic evaporation.” Continue reading